INTRODUCTION
Monitoring athletes longitudinally is useful for coaches and athletes to set goals over single or multiple seasons (Pyne et al., 2004) and to evaluate the effectiveness of training and coaching programs. Additionally, understanding the developmental pathways of emerging athletes (e.g. junior to senior) is useful for optimising talent development programs. Longitudinal monitoring research has been published in many sports including, track and field (Chapman et al., 2014), sprinting (Meyers et al., 2016), rugby (Alaphilippe et al., 2012; Till & Jones, 2015), football (Mirkov et al., 2010; Trexler et al., 2017), swimming (Anderson et al., 2006; Psycharakis, 2011), tennis (Roetert et al., 2000) and basketball (Scanlan et al., 2012). Typically, longitudinal monitoring has focused on strength (e.g. Boyce et al., 2009), anthropometric and physical performance measures (e.g. Mirkov et al., 2010), growth and fitness (e.g. Till and Jones, 2015). Limited research has monitored the development of movement competency in athletic populations, apparently no empirical studies investigating the progression of talented golfers.
There has been a number movements screens developed which test general movement competency (Kritz, 2012), resistance training (Loudon et al., 2014) and single exercises (e.g. back squat assessment; tuck jump assessment) (Myer et al., 2008, 2014). However, there has been a limited amount of research that has investigated if such screens have the ability to detect changes in movement competency over time. Currently, the functional movement screen (FMS) is the most common screen that has been used to track movement longitudinally. The functional movement screen (FMS) has been used to monitor the effectiveness of shorter-term, 12-week training programs (Frost et al., 2012; Minthorn et al., 2015), however, very little research has investigated competency from a long-term perspective. Sprague, Mokha and Gatens, (2014) investigated movement development of 57 football and volleyball athletes over a 3.5-month period using the FMS, but no significant improvements in competency were observed. Waldron et al., (2016) tracked twelve elite rugby players over a 9-month competitive season, but again no significant changes in FMS total exercise score were observed. It may be that the programs implemented were not effective to promote improvements in movement competency, observation periods were too short or that the FMS lacks sensitivity to detect changes in movement competency. Currently, there has only been one study that has found significant changes in a muscular skeletal screening within professional golfers, which found improvements in left leg bridging (6.6%), thoracic extension (62.5%), right thoracic rotation (23.3%), and right (20.8%) and left single leg squat (29.1%) (Olivier et al., 2016). However, there were no changes in performance over this period and there is no literature that supports the tests have any correlation to performance. Therefore, longer observation periods and the use of screens that are move specific to the movement demands of a given sport may provide more positive findings.
The golf movement screen (GMS) has been developed specifically to test the movement competency of golfers across exercise relevant to golf and strength and conditioning. The GMS includes a total of 10 exercises that are assessed through rating individual body segments within each exercise. The screen has been shown to have excellent levels of intra and inter-rater reliability (Gould et al., 2017), therefore, if changes in test score are observed over time a practitioner can have confidence that those changes are real and do not reflect variability in test performance. Additionally, the screen has been shown to be related to biomechanical performance of the golf swing (Gould et al., 2018). Specifically, all exercises in the screen have shown associations with spine biomechanics during the swing, while some of the exercises are related to X-factor (Gould et al., 2018). X-factor is a useful strategy for golfers to use in order to improve driving distance (Meister et al., 2011) and is defined as the separation between thorax and pelvis during the golf swing (McLean & Andrisani, 1997). Therefore, it is clear that the GMS can be reliably used by single and multiple raters and has shown to be related to golf performance (Gould et al., 2017). However, it is unknown if movement competency changes over multiple seasons in golfers. A better understanding of how movement competency develops in golfers would be useful for practitioners so specific exercise interventions can be used to help golfers improve their movement competency longitudinally. Additionally, understanding movement improvements of golfers in a talent development programs will help practitioners profile golfers and individualise support given based on movement competency on entry and rate of development over time. Therefore, the aim of the study was to longitudinally monitor the movement development of high-level golfers using the GMS.
METHODS
Experimental approach to the problem
This study presents a longitudinal investigation of the development of movement competency in talented golfers using the golf movement screen (GMS). A repeated measures study was conducted over a two-year period. Participants were assessed on their movement competency, using the Golf Movement Screen, on three separate occasions with a year between each testing.
Participants
In total, 112 golfers have been screened using the GMS which included 74 males and 38 females with a mean age of 14.2 ± 2.55 years. For this study, 36 high-level golfers (24 males and 12 females) remained in the development program over a two-year period, therefore, were taken forward for the longitudinal analysis. All participants were part of regional and national age group squads run by the national governing body as a talent development program. The primary focus of the program was to provide technical coaching of the golf swing alongside strength and conditioning, biomechanical and psychological support integrated into the program. Participants received varied levels of strength and conditioning support over the 2-year period, depending on which squad they were affiliated with. The squad structure provided a total of two individual strength and conditioning sessions per season at academy level, five at regional level and 12 at national level. The participants were given individual programs to follow outside of coaching sessions. At entry into the program the average age of the participants was 14.38 ± 2.88 years ranging from 10-22 years and the average handicap was 6 (range +3 to 18). All participants had not previously been screened using the GMS before the first data collection session. However, seven participants had received strength and conditioning support before the first year of data collection, the remaining participants had no strength and conditioning experience prior to the study. The project received ethical approval which was granted by the universities research ethic committee in accordance with the declaration of Helsinki. Participant consent and where necessary participant assent and parental consent, were collected prior to the commencement of testing.
Procedure
Participants were tested across all 10 exercises on the GMS. Total GMS score, total exercise score and selected body segments during each exercised were all analyzed. Golf handicap was also reported which is a numerical figure that describes the playing ability of a golfer and is an objective measure of golf performance. The golf handicap is used to balance the playing ability of golfers, against the golf course or opponent. Consequently, handicap is the best predictor of golf performance. Data were collected on three separate occasions over a two-year period during national training sessions; on entry to the study participants were assessed at the start of the season, then again at the same time point each year for the following two-years. Participants self-reported their handicaps, which were verified with the national governing body. Prior to testing, each participant performed a golf specific warm-up. The GMS procedure included a total of three demonstrations performed by the rater from the sagittal and frontal viewpoint of each exercise. The participants performed each exercise, which was videoed and assessed via an iPad (iPad mini, Apple, USA).
The Golf Movement Screen (GMS)
The golf movement screen (GMS) is a reliable (Gould et al., 2017) and valid (Gould et al., 2018) screening protocol that has been designed to test the movement competency of golfers. The GMS consists of 10 exercises, during each exercise the movement or position of a number of body segments are rated. Dependent on the exercise body segments are rated from the frontal and/or sagittal view, and if unilateral (e.g. the lunge) on both the left and right side. Body segments are rated in each view with a pass (1) and fail (0) based on specific the criteria for each exercise. Body segment scores are added together to give an overall score for each exercise and the scores for each exercise are then summed to provide a composite score for the GMS. Not all exercises have the same total score, the lowest total score is trunk inclination which ranges from 0-4 because it has 4 body segments to be rated, the highest number of body segments to be rated is the lunge which has a total of 0-18, with 9 on the right leg and 9 on the left. The total score for the remaining exercises range between the trunk inclination and the lunge, by accumulating all exercise scores the total GMS score ranges between 0-93. A full copy of the screening document with description of the rating criteria for each body segment and each exercise can be found in (Gould et al., 2017). A brief description of each exercise included in the screen is provided in table 1.
Statistical analysis
Means and standard deviations were calculated for the total GMS and handicap on entry, year 1 and year 2 (mean ± SD). Total exercise scores were assessed for normality using a Shapiro-Wilks test. Differences in total GMS score, total exercise scores and handicap across the two years were examined using a repeated measures ANOVA for parametric data and Friedman test for non-parametric data. Effect sizes (ES) were used to determine the magnitude of difference between test occasions and were calculated using Cohen’s d, with thresholds interpreted as <0.2 = trivial, 0.2-0.59 = small, 0.6-1.19 = moderate, 1.2-1.99 = large, >2.0 = very large (Hopkins et al., 2009). Typical error of the total GMS was assessed on 20 golfers performing two trials of the screen. Typical error was calculated from reliability data for the total GMS score, individual changes that were above the typical error were consider “real”. Frequency count was calculated for the number of participants that improve by three or more from entry to year 1, year 1 to year 2 and entry to year 2. Frequency count of individuals that maintained or improved total exercise score from entry to year 1, year 1-2 and entry-year 2 were also calculated.
RESULTS
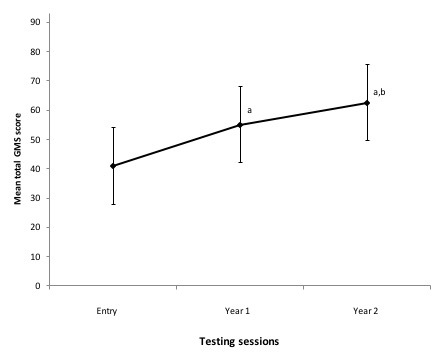
The entry mean score for 112 participants was 41 ± 12.38 which is similar to the entry score of participants in the longitudinal analysis show in table 2. Frequency count indicates that from 112 golfers 17 golfers scored between 0-30, 86 golfers scored between 31-61 and 9 golfers scored between 62-93. The longitudinal analysis showed significant improvements occurred in total GMS score across each test point (p < 0.05, Figure 1). The mean total score of the group increased by a moderate amount from entry to year 1 (ES = 1.06) and a small amount from year 1 to year 2 (ES = 0.57), resulting in a large cumulative improvement of 22 ± 8.96 points from entry to year 2 (ES = 1.59). In total, 33 golfers improve by more than the typical error from E to year 1, 32 from Y1 to Year 2 and 36 from Entry to year 2. There were simultaneous improvements in golf handicaps as significant differences were reported between handicaps at each test point (p < 0.05). Specifically, on entry the average handicap was 6 ± 5.17, ranging between +3 and 18, by year 2 it was 2 ± 3.75, ranging between 9 and +3. The effect size change for handicap highlighted a small difference between entry and year 1 (ES = 0.56) and year 1 to year 2 (ES = 0.29), and a moderate difference from entry to year 2 (ES = 0.85).

Table 2 shows improvements in each exercise over the 2-year period. Side plank scores were near maximum on entry, with participants scoring an average of 5/6 (83% of criteria passed). Scores for the side plank then remained stable and did not significantly change over the two years. Scores for other exercises were relatively lower on entry, with an average of 25-63% of criteria passed, most of those exercises displayed a significant improvement from entry to year 1 and all significantly improved from entry to year 2 (Table 2). By year 2 the average percentage of criteria passed in each exercise ranged from 50% (seated hamstring and basic balance) to 88% (basic balance).
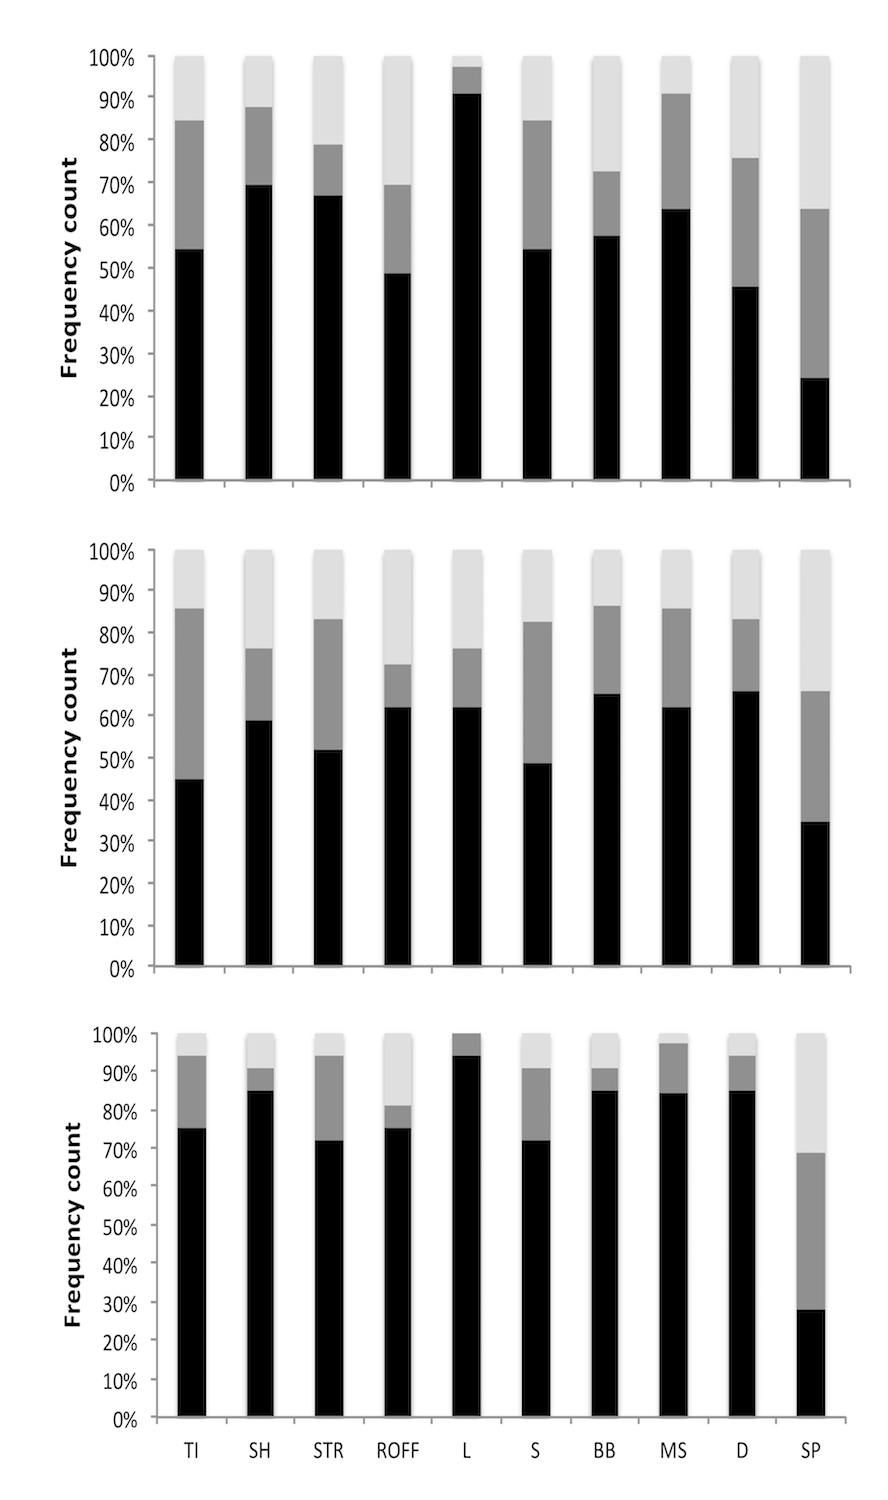
In total, 100% of participants improved their total GMS score from entry to year 2. Figure 2 shows the percentage of participants who improved, maintained or decreased total score for each exercise between each year and from the start to the end of the program. Across the different exercises 64-97% of participants either maintained or improved performance from entry to year one and from year one to year 2. When excluding the side plank 72-94% of participants improved total exercise scores between entry and year 2 (Figure 2).
_of_individuals_that_improved_(black)_maintained_(dark_grey)_or_decreas.jpg)
DISCUSSION
The aim of the study was to longitudinally monitor the movement competency of high-level golfers in a national talent development program. The main findings from this study were that the total GMS score significantly improved across multiple years, with simultaneous improvements in handicap. The total GMS score showed large improvements from entry to year 2. Simultaneously, total score improved in all of the exercises in the screen apart from the side plank, with the lack of improvement in the plank likely due to the high levels of competency in the movement (i.e. near maximum scores) at entry. The results indicated that most participants were able to maintain or improve competency scores for all exercises. However, the average number of criteria passed for each exercise at year 2 ranged from 50-88%, reflecting varying levels of competency across different movements at the end of the study. This study is an observational study and no specific interventions were used, therefore, changes could have occurred due to a combination of reasons, such as baseline score on entry and the level of strength and conditioning exposure each participant had throughout the program.
The current study showed significant improvements in total GMS score and handicap between each testing point. Currently, it is difficult to establish a cause and effect-relationship between the movement competency and handicap. Previous research that examined longitudinal changes in movement competency found no significant changes in total FMS score in female soccer players (Sprague et al., 2014) or rugby players (Waldron et al., 2016) over a 3.5 and 9-month period respectively. In those studies, the amount of training each participant received over each time period is unclear. In the present study it is likely that the amount of technical training and strength and conditioning support that each participant received, together with the amount of competitive golf participants played helped them substantially improve their movement competency as well as their handicap.
Total exercise score on entry varied across movements; on average participants were close to being fully competent at the side plank, whereas for most other movements the average competency on entrance was low. Apart from seven participants, the group had not previously received any strength and conditioning coaching or completed any targeted exercise programs. Therefore, individuals may not have had the conceptual understanding of movement or did not have the neuromuscular co-ordination to move competently upon entry into the program. Nevertheless, total exercise score improved in 9 of 10 exercises from entry to year 2, resulting in the large improvement in total GMS score. Baseline fitness is known to influence the responsive to training in a variety of physical qualities, with lower initial fitness typically allowing for greater gains in performance (Stodden & Brooks, 2013). The large improvements in movement competency observed between entry and year 2 in the current study may have occurred due to initial relatively low scores on entry, allowing for a more positive responsiveness to training.
Over the two years the improvements in pass rate varied across exercises, with some showing large improvements (e.g. mini squat and seated hamstring) and others showing less improvement (e.g. rotation over fixed foot) or no improvement (e.g. plank). Exercises that scored lower on entry, such as the seated hamstring and mini-squat, tended to demonstrate the most improvement. This observation may reflect the fact that those exercises were more novel to participants, exposing them to movements they were less familiar with. Rotation over fixed foot is a measure of internal rotation of the hip, reflecting the movement of the golf swing (Gould et al., 2018). Golf is a high repetition sport that involves multiple golf shots requiring the same action in the same direction. The high repetitions performed in golf may make it more difficult to achieve larger improvements in an exercise that replicates the golf swing such as the rotation over fixed foot, as poor movement patterns may have become ingrained. Practically it should be expected that larger improvements are made in exercises with lower total score on entry while it may be more difficult to improve movements that more closely replicate the golf swing. More targeted interventions may be needed to improve the movement quality of rotational movements in golfers, but more research is needed to confirm this.
The side plank is the only isometric exercise in the screen, which may be easier to pass for individuals who have less strength and conditioning experience as even those with a low training history demonstrated competency in the exercise. While it may be easy to score well on a test of static core control (e.g side plank), participants initially struggled more with the trunk inclination which challenges dynamic trunk control. This is supported by Loudon et al., (2014) who reported that participants only scored a competency rating of 6/10 when performing chest touches during a plank exercise compared in the findings of the side plank in the current study. Moving and maintaining posture in the trunk may make an exercise considerably more challenging compared with static core exercises. Practically, when participants display high-levels of static plank competency it may be worth adapting training and making screening exercise more challenging in the plank positon by adding arm movements whilst holding the side plank position.
The frequency count results identified that 72-94% of the group improved total exercise score in 9 of 10 exercises between entry and year 2. Although, this is the first longitudinal investigation on the GMS, elements of the FMS (e.g. overhead squat, in-line lunge and shoulder mobility tests) have been analysed in previous research. Competency in these movements has been shown to improve following a 12-week movement intervention (Skotnicka, 2017) and during part of the competitive season in football and hockey (Sprague et al., 2014), but improvements were not found following a single rugby season (Waldron et al., 2016) or after other short-term interventions (Frost et al., 2012; Wright, 2015). It is unclear as to exactly why more consistent improvements were observed in the current study. Potentially, individuals in the sample received more strength and conditioning support than in previous research or that the longer-time period of the present study allowed for more change to be observed. It may also be that the relatively young age of the sample played a role, with many of the participants not fully mature on entry. Younger and less mature athletes have a larger potential to improve motor skill competency due to their heightened neural plasticity (Malina et al., 2004). The process of maturity coupled with low initial GMS scores, low training age and strength and conditioning support provided over a long observation period, may all have contributed to the large improvements in movement competency in the present study.
To conclude, the total GMS score improved by a large amount over a two-year period and at same time handicap improved. Competency in nearly all exercises improved over the two-year period. This suggests a broad range of movement competencies improved in golfers enrolled in a talent development program for two years. Given the excellent intra-rater reliability of the screen (Gould et al., 2017) the outcomes should reflect real changes in competency in the nine movements where improvements were observed. However, the magnitude and consistency of changes varied across exercises. While competency in some exercises was very good at the end of two years for other movements it remained lower despite improvements over the two-year period. This may be due to a combination of complexity of the movement, baseline competency and the effectiveness of the program to target movement deficits. This study is an observational study and no specific interventions were used, therefore, changes could have occurred due to a combination of reasons, consequently, future research should investigate specific training interventions that help movement competency of golfers improve at a fast and more efficient rate.
PRACTICAL APPLICATIONS
Strength and conditioning coaches working in golf can use the GMS to monitor talented golfers in a development program over multiple seasons, as this research has shown that the screen is sensitive to change. Specifically, the screen can be used to help coaches individualize golf relevant strength and conditioning programs. Coaches should start by using the total GMS score to measure the overall movement competency of golfers and then use the data to help inform targeted training interventions to address individual movement deficits. Strength and conditioning coaches should be mindful that responsiveness to training will likely vary based on baseline levels of movement competency and training history. Movements that more closely replicate the golf swing, such as the rotational movement, may be more difficult to change due to ingrained movement patterns. Therefore, coaches should adapt interventions where movements are showing slow rates of improvement. Lastly, it could be suggested that golfers should be screened at least once annually, but strength and conditioning coaches could use the screen more frequently to continually inform prescription.