


Introduction
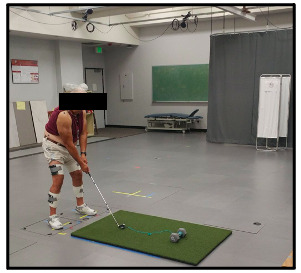
A fundamental challenge in prescribing exercise for older adults is finding a comprehensive program that incorporates the range of necessary physical demands while promoting adherence and engagement. According to the American College of Sports Medicine’s (ACSM) activity guidelines for older adults, comprehensive programs should incorporate cardiorespiratory, balance, strength, and cognitive demands (Liguori, 2020). Golf is a multi-component outdoor recreational activity that involves a variety of environmental challenges (e.g., hills, sand traps, high and low-grass, and other obstacles) and physical demands including the golf swing, putting, squatting, and walking long distances (Figure 1). In golf, a large amount of upper and lower-extremity muscle activation is required during the swing (McHardy & Pollard, 2005). Bending to pick up or place a ball is similar to a squatting, crouching, or kneeling (SCK) activity, where performance in older adults is correlated with plantar-flexor and knee-extensor muscle strength (Hernandez et al., 2010).

Research affirms that golf is associated with numerous health benefits in both experienced older adults (Murray et al., 2016; Tsuji et al., 2020), and those learning the game (Du Bois et al., 2021; Kanwar et al., 2021; Shimada et al., 2018). Moreover, golfers tend to live an average of 5-years longer than non-golfers, regardless of gender or socioeconomic status (Farahmand et al., 2009). Recently, it was reported that older male military veterans, novel to golf, demonstrated medium-large effects, in improved hip strength, 30-second chair stand performance, 8-foot up-and-go time, and dynamic balance, following a 12-week golf-training program (Du Bois et al., 2021). Similarly, a 10-week golf program at a public course demonstrated medium to large effects in improved walking speed, dual-task walking performance, lower extremity strength and agility, tandem static balance, and cognition, in both males and females (Farahmand et al., 2009; Kanwar et al., 2021; Moore et al., 2022).
A plausible rationale for these improvements in walking, balance, and dual-tasking are the multiple physical and cognitive challenges associated with the golf play and golf training programs. To date, however, researchers have not quantified the quantity and magnitude of the demands associated with golf-related activities; especially in older populations learning to golf. Understanding the relative mechanical demands (e.g. peak net joint moments (PJM) and impulses (IMP)) of a round of golf compared to other exercise activities, (e.g., walking and body-weight (BW) squatting) will help better understand the golf-related stimuli that may have contributed to the improved effects in physical performance. Moving forward, understanding the demands of golf will allow clinicians to safely and effectively prescribe golf as a potential fitness intervention and make informed decisions about starting or returning to golf activities. Thus, the aim of the current study was to quantify the lower-extremity (LE) physical activity demands associated with a nine-hole round of golf, played by community-dwelling older adults, following a 10-week golf training program for non-golfers. We hypothesized that the lower extremity mechanical demands of golf activities (e.g., walking, squatting, & swing) would equal or exceed the lower extremity demands found in common bodyweight exercises for older adults, and that the average mechanical demands across activities would be similar between limbs.
Methods
Experimental Design: The LE physical demands associated with a nine-hole round of golf were quantified by determining the average: 1) distance walked, 2) number of steps taken, 3) number of times participants bent/squatted to place or pick-up a ball (SCK activities), and 4) number of swings taken (not including putts). Additionally, the biomechanical demands associated with these activities were examined by having the participants repeat the activities while instrumented in a motion analysis laboratory. The average LE peak net joint moments (PJMs) and joint moment impulses (IMPs) engendered during each activity were then calculated.
Participants: Participants were recruited from the greater Los Angeles area using flyers, presentations at senior recreational facilities, and recommendations from participants in the program. Inclusion/exclusion criteria are provided in Table 1. Following phone screening and approval by their primary care physician, 7 female and 7 male participants (69.3±5.9 years) provided their consent and were enrolled in the study. Prior to participant involvement, the study was approved by the USC Institutional Review Board (HS-17-00004) and registered with clinicaltrials.gov (ClinicalTrials.gov NCT03916887). Baseline testing, which included measures of strength, balance, functional performance (e.g., timed up and go), dual-tasking, and cognition, occurred within one week of the beginning of the golf training program.
Golf Training Program: Participants were provided with 10 weeks of twice-weekly golf instruction. The golf instruction took place under the supervision of a PGA-certified golf professional, at Monterey Park Golf Course (Monterey Park, CA, USA), which is a 9-hole public golf course (Par 29; course length: 1280 m). Each 1.5-hour session began with golf-specific warm-up exercises to prepare participants for the physical demands of golf. Participants received instruction in the golf swing under the supervision of the PGA professional at the course driving range. Participants began on-course play beginning at week 4 and pushed a hand cart. Over successive weeks, driving range practice was reduced while the number of holes played increased until participants were playing 9 holes of golf during the 9-10th weeks. Additional details of the program have previously been reported (Kanwar et al., 2021; Moore et al., 2022).
Nine-hole Round of Golf Activities: On the tenth week, during the participant’s last day of the intervention, they played the entire nine-hole course. During that time, the total swing counts, (excluding putts) as well as the number of SCK activities were recorded. Additionally, the total distance walked and steps taken by each participant were measured using the Fitbit Surge activity tracker (Montes et al., 2020).
Biomechanical Analysis: Within one week following the intervention and nine-hole round, biomechanical analysis of the participant’s SCK activities and golf swings took place at the Jaqueline Perry Musculoskeletal Biomechanics Research Laboratory of USC. Retroreflective markers were placed on participants using a standard lower extremity and trunk marker set (Wang et al., 2003). Kinematic data were collected at 180 Hz using an 11-camera Qualisys® digital motion capturing system (Qualysis, Gothenburg, Sweden). GRF data were collected at 2520 Hz using 2 in-ground force plates (AMTI, Watertown, MA, USA), one under each foot.
SCK Activities: To mimic the SCK activities (placing, retrieving or marking a ball), participants held a golf ball marker in their dominant hand and a pitching wedge in their non-dominant hand while standing on 2 force plates with a golf ball sitting on turf in front of their feet. They were then instructed to adjust their foot position, while remaining on the force platforms, so that they assumed the preferred distance from the ball that they used on the course. The participants were then instructed to “bend over and place the marker behind the ball, pick up the ball, and rise back to their standing position, as you would do on the course”. Participants were allowed to: 1) use the club in their non-dominant hand on the turf to facilitate balance or 2) continue holding the club at their side, without contacting the ground, while performing the task (Figure 2). Participants that used the club for assistance/balance while performing these tasks on the course, also used the club in the laboratory. Three of the 14 participants used the club for support during the task.

Golf Swings: During the golf swing data collection, the participants were instructed to hit 5 golf shots each with a 7-iron and driver, towards a target (20-feet away), to mimic the clubs most used on the course during play (Figure 3). The two clubs had negligible differences between PJMs and IMPs analyzed for each joint; therefore, the 7 iron and driver values were averaged together. A static calibration trial was collected prior to the dynamic trials with each club. All participants were right-handed golfers; therefore, the left limb was the lead limb while the right limb was the trail limb.

Data Reduction: For each club, the first 3 successful trials, in terms of marker tracking quality, were used for further processing. A 6-degree-of-freedom model was used, and local coordinate systems were created using the static calibration trials. A fourth-order Butterworth low-pass filter with 6 Hz cutoff frequency was applied to the marker trajectories and GRF data. Three-dimensional internal PJMs were calculated from the anthropometric, kinematic, and GRF data with inverse dynamics equations, using Visual3D musculoskeletal modeling software (C-Motion, Inc, Germantown, MD). The PJMs were averaged across the three trials and normalized to body weight. IMPs were calculated as trapezoidal numerical integration of the net joint moments during each task. Data processing and reduction were performed with MATLAB custom codes (R2020a; The MathWorks Inc, Natick, MA) and Microsoft Excel (Microsoft Corporation, Redmond, WA).
Statistical Analysis: Walking distance, steps taken, and the number of SCK and swing activities during the 9-hole round of golf are reported as mean ± standard deviation. Additionally, the average PJMs and IMPs during the golf swings and the SCK task are also reported as mean ± standard deviation. Normality was tested using Shapiro-Wilk test. Paired-samples t tests were performed to distinguish differences between lead (left) and trail (right) limbs (α = 0.05) during the swings and SCK task for normally distributed variables. Otherwise, Wilcoxon signed-rank tests were used for non-normally distributed variables. All statistical procedures were performed using MATLAB custom codes (R2020a; The MathWorks Inc, Natick, MA).
Results
Feasibility and Safety: Participants completed 283/300 (94%) golf training sessions with no program related adverse events. A total of 12 participants completed the MBRL collection. Two participants did not complete the biomechanical analysis for reasons outside of the study protocol.
Walking (Step counts & distance), SCK, and Swing Activities: Participants walked an average of 2.90 ± 0.60 km (1.8 ± 0.37 miles), took an average of 4100 ± 968 steps, performed an average of 24 ± 8 SCK activities, and took 41 ± 9.94 swings, not including putts, during the course of the nine-hole round.
Biomechanics: Average internal PJMs and IMPs for the swing and SCK activities are reported in tables 2 and 3, respectively. The largest PJMs and IMPs occurred in the sagittal plane for the ankle, knee, and hip. During both swing and SCK activities, average transverse plane PJMs and IMPs, at the ankle, knee, and hip, were small and 2-14 times less than the PJMs and IMPs in the sagittal plane. Frontal plane average PJMs and IMPs at the knee and ankle were also smaller (1.5-6.8 x less) than those in the sagittal plane. Only the average frontal plane PJM and IMP at the hip, during the golf swings, were comparable to those in the sagittal plane.
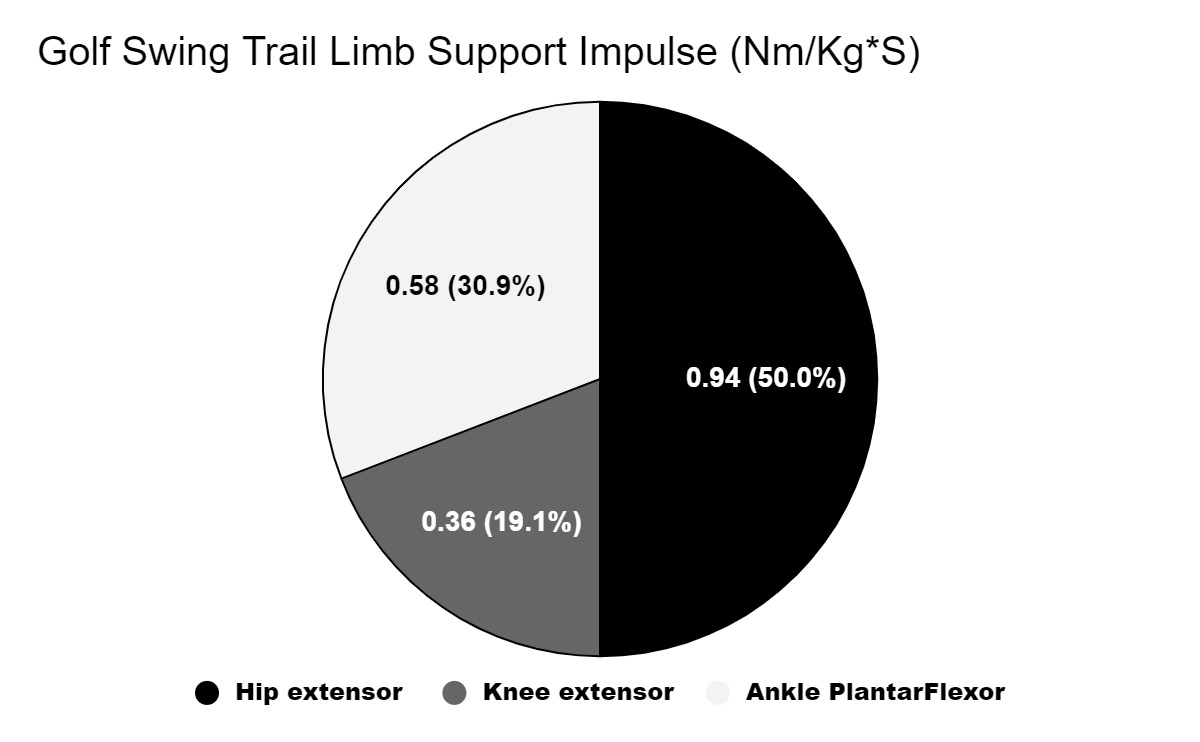
Figures 5-8 illustrate the extensor impulse at the hip, knee, and ankle, calculated as percent of the total support impulse generated during swings and SCK activities. During the swing, the greatest contribution to the total support impulse, for both the lead and trail limbs, was at the hip (lead 41% and trail 50%). The knee contribution for lead and trail limbs was 26% and 19%, respectively, whereas, the ankle contribution was 34% for the lead limb and 31% for the trail limb.


_activities_left_limb_support_impulse_chart.png)
_activities_right_limb_support_impulse_chart.png)
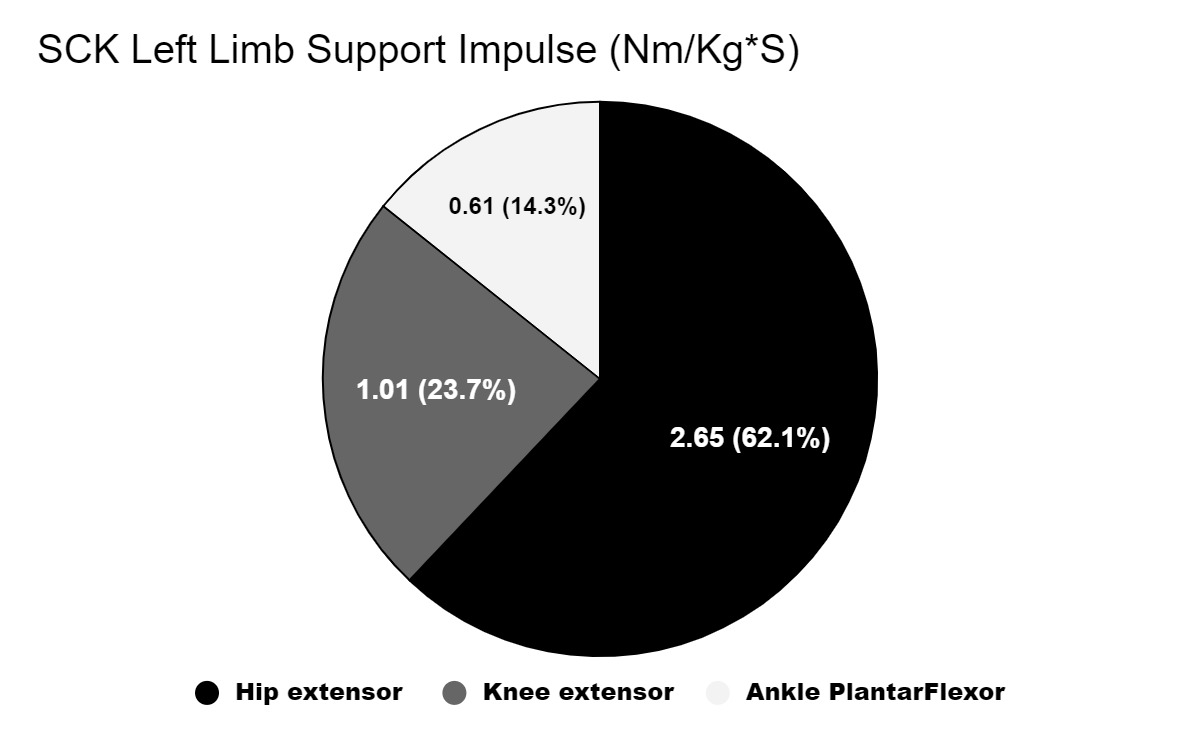
During the SCK activity, the total support impulse contribution was dominated by the hip with 62% for the left limb and 53% for the right. The knee was the next largest contributor at 24% and 32% for the left and right limbs, respectively. The ankle contribution was 14% for both limbs.
During the golf swing, the average extensor PJM and IMP for the right hip was larger while the left hip PJM and IMP were larger during the SCK activity. The average extensor PJM for the left knee was larger during the golf swing while the right was larger during the SCK activity. The differences between right and left hip abductor PJM and IMP, during swings, approached statistical significance (p = 0.075 and 0.064 respectively) with the right limb being greater. Hip abductor PJM and IMP during the SCK activity were small and 1.4-4 x less than those during the swing.
Discussion and Implication
The purpose of this study was to quantify the LE mechanical demands accrued during a 9-hole round of golf played by community-dwelling, healthy older adults at the end of 10-week golf training program designed for novice golfers. Understanding the demands of the various components of golf play will allow clinicians, personal trainers, and exercise specialists to compare these to other commonly used exercise activities for older adults and to prescribe
appropriate exercise programs that may include golf. The results can also be used to make recommendations about starting or returning to golf activities. The primary golf components with significant LE demands include walking while transporting golf equipment via hand pushcarts, the golf swings, and SCK activities.
Walking: Participants in our study walked an average of 2.9 ± 0.6 km, which is at the lower range of walking distance for 9-hole golf play. Dear, Porter, and Ready (2010) reported older adult males walked 4.4 ± 3.6 km in a 9-hole round of golf while using hand pushcarts for club transportation on a public golf course (course length: 2505 m) in Canada. Zunzer et al. reported average walking distances of 5.32 ± 0.48 km in males and 5.25 ± 0.76 km in females for 9-hole rounds of golf on four different 18-hole championship golf courses (course length: 5525-5919 for men and 4871-5307 for women) in Austria (Zunzer et al., 2013). The variability in walking distance is expected in golf because walking distance depends on the course length, method of club transportation, and the golfers’ skill level (Luscombe et al., 2017). The current study took place at a Par 29, 9-hole golf course with a playing length of 1280 m. Over the approximately 3km walking distance, the participants took an average of 4100 steps. In general, golf courses have a wide range of length, terrain types, and elevation changes which influence a player’s distance traveled, step count, and intensity. Furthermore, although elevation changes experienced by our participants were not directly measured, the elevation change of the golf course was estimated using open-sourced satellite imagery software (Google Earth Pro, Google LLC, Mountain View, CA). Along the straight path from tee to green illustrated in Figure 8, the uphill and downhill elevation changes were 152 ft and 130 ft, respectively. To provide context, if we assume the typical vertical height for a flight of stairs is 3.7 m, then the participants in the current study traveled approximately 13 flights of stairs downward and 11 flights of stairs upwards, over the 9-hole course. This is the minimal value because golfers typically do not walk in a straight line from tee to green, especially novice golfers. This claim is also supported by the greater distance walked by the participants (2.9 km) compared to the golf course length (2.5 km).
Recommendations by the ACSM suggest a goal of 10000 steps (~8km) per day for all adults (ACSM, 2018); however, there are no recommendations for stair-flights climbed. Thus, this shorter than typical 9-hole round of golf provided approximately 38-40% of the ACSM recommended daily steps/walking distance. Currently, it is unclear how the added task of using the hand pushcart for golf equipment transportation influences the LE demands of walking. Therefore, although we can estimate the distance traveled and steps taken by golfers, future studies should explore the biomechanics of golf equipment transportation tasks to better estimate LE demand associated with walking in a round of golf.
Biomechanics, Swings, and SCK Activities
To the author’s knowledge, the current study is the first to quantify LE biomechanical demands of the golf swing and SCK activities in healthy older-adult novice golfers. To better appreciate how these LE demands related with those of other body-weight (BW) exercise activities, we compared our PJM findings to published data from older males and females (average age between 70-85 years) previously tested during squatting (Flanagan & Salem, 2003), forward and lateral stepping (Wang, 2003), and forward and lateral lunging (Flanagan et al., 2004) activities in MBRL (Table 3).
The comparisons revealed that the hip extensor PJMs generated during the swing and SCK activities were approximately 7% greater than those generated during the squatting, stepping and lunging BW exercises. Average golf knee extensor PJMs generated during the swing and SCK activities were approximately 25% less than those generated during BW exercises. This difference was largely influenced by the stepping and lunging activities, which generated the largest knee extensor moments among exercises. The squatting and chair squatting activities, however, produced knee extensor PJMs which were similar to those generated with the golf activities. At the ankle, average golf plantar-flexor PJMs generated during the golf activities were approximately 22% less than those generated during BW exercises. Thus, in summary, the golf activities produced sagittal plane PJMs which were greater at the hip, but somewhat less at the knee and ankle, compared to common BW exercises for older adults. Our calculated biomechanical demands of the golf swing are similar to those reported by Lynn et al. between the lead and trail limbs within adults aged 49-79 years. The researchers also found that the biomechanical demands of the golf swing exceeded that of both walking and sit-to-stand activities in this population (Lynn et al., 2023). In the present study, the participants performed 24 ± 8 SCK activities during a 9-hole round of golf, or approximately 3 SCK activities per hole. They also performed an average of 41 ± 9.94 swings per round or 4.6 swings per hole, not including putts. ACSM recommends at least 1 set of 8-12 repetitions when training for strength, however, 2-3 sets may provide additional benefits (ACSM, 2018). Thus, participants in the present study would have easily met the ACSM recommendations for strength/power exercises with each 9-hole round.
The swing and SCK activities produced average LE sagittal plane PJMs and IMPs that were 1.5-14 times greater than those in the transverse and frontal planes, suggesting that these golf activities generated primarily sagittal plane mechanical demands in this group of older adults, novel to golf. Although younger, more experienced golfers, are like to generate relatively greater transverse and frontal plane PJMs and IMPs, the sagittal plane demands in this cohort, may help explain their improvements in walking, chair stand, and timed up and go performance, reported previously (Moore et al., 2022). Based on the sagittal plane IMPs, these activities could also be considered hip dominate, with the hip accounting for between 41-62% of the total support IMP.
An important consideration, when using golf as an exercise intervention, is the potential unequal moments generated between limbs. Without addressing these asymmetrical demands, players may be overtaxing one limb/joint and underloading the other. These asymmetrical demands could potentially contribute to osteoarthritis (Felson, 2004). The current study, however, suggests that for some joints, the combination of swing and SCK activities, may help “balance out” the between limb differences found with swing or SCK activities alone. For example, our participants demonstrated 24% higher average right (trail) hip extensor IMP during swings, but a 23% higher average left hip extensor IMP during SCK activities.
In the transverse plane during the swing, however, left and right IMP differences at the hip were not balanced out by SCK activities. These findings are to be expected with a unidirectional activity such as the swing, in comparison to the SCK activity in which the greatest joint excursions, PJMs, and IMPs, occurred in the sagittal plane.
Interpretation of these findings should take into account the limitations of the study. Although we compared the mechanical demands of golf play with data obtained from previous squatting, lunging, and stepping experiments in older adults, we would have preferred to have the golf participants perform the BW activities while instrumented in the lab. Unfortunately, laboratory testing already included multiple physical fitness, muscle strength, gait, and balance tests that prevented the addition of further tests due to time commitment and participant fatigue. Additionally, the participants within this study were novice golfers and received only 10-weeks of golf training. A longer study with more time spent playing a full 9-hole or 18-hole course may provide different effects from the program. Experienced golfers who have played regularly for many years may also have different fitness effects from when they first started playing. Longer duration study interventions and comparisons between novice and experienced golfers should be considered for future work. Another limitation is that the golf swing and SCK analyses were performed in a laboratory setting, on plastic turf. Participants being tested in this environment, as opposed to course play, may have had variations in their golf swings and the effort they applied.
In summary, ACSM recommends endurance and strength activities, balance, and range of motion (ROM) training, and multicomponent exercise (ACSM, 2018). Golf presents a unique exercise modality that includes long walking distances over hilly terrain (aerobic), squatting maneuvers to pick up and place the ball (lower extremity strength), high power swings (ROM and dynamic balance), quiet standing during putting (static balance), and social and cognitive aspects as well (Figure 1). Indeed, our group has found that 10 and 12-week golf programs generated medium-large effects in improved performance on Senior Fitness Test (Rikli & Jones, 2013) measures of lower extremity strength and agility, static balance, and aerobic endurance in older adults (Du Bois et al., 2021; Moore et al., 2022). This knowledge, combined with our findings of 94% adherence and no-golf related injuries, suggests that golf is an activity that should be considered for maintaining or improving physical function in healthy older adults. The reported results can be used by clinicians to make recommendations about starting or returning to golf activities. This report is also consistent with previous golf and health reviews and the International Consensus Statement on golf and health (Murray et al., 2016, 2018; Sorbie et al., 2022).
Conflict of Interest Disclosure
None
Author Contributions
All listed authors of this manuscript have satisfied the criteria for authorship.
Acknowledgements
The authors would like to thank Karen Lee for her help with participant tracking on the golf course. We would also like to acknowledge the PGA golf professional Kevin Norwall for golf instruction within the program. The study was funded by a grant from the Royal & Ancient (Grant #: GHA0012017).
This manuscript has not been published or submitted to any other journal.