
1. Introduction
In golf, hitting a long and well-positioned drive contributes to a golfer’s success (Hellström et al., 2014). A well-positioned ball can be described as one which lies in the fairway, optimizes the angle of the second shot to the pin, and minimizes the distance of the approach shot. This kind of advantage can be gained by enhancing the factors that produce an increase in driving distance and accuracy. In particular, a player’s clubhead speed at impact is the most influential factor in determining driving distance, and driving distance has been shown to be more important relative to driving accuracy in shooting lower scores on the PGA Tour (Broadie, 2018). Further, the importance of driving distance relative to accuracy increases with handicap (Broadie, 2014).
Clubhead speed is clearly important to golf performance, and the high proportion of golf research studies focused on understanding the swing characteristics associated with it supports this assertion. Since the critical analyses contained in Cochran & Stobbs (1968) over 50 years ago, clubhead speed has been associated with factors such as center of pressure patterns, delaying wrist release, and pelvis-torso relationships (e.g., X-factor), to name a few prevalent concepts. For example, Ball & Best (2007) suggested that golfers could be categorized based on their center of pressure pattern during the swing. They determined that for ‘front foot’ style golfers there were significant correlations with clubhead speed for the velocity with which the center of pressure shifted towards the target (r = .46, p = .004) and the range of center of pressure along the target line (r = .53, p= .001). Chu et al. (2010) measured 308 golfers and found a significant relationship between wrist cock angle at last shaft parallel in the downswing and clubhead speed. Specifically, their regression model predicted that a decrease in wrist cock angle late in the swing (i.e., delayed release) of 10° was associated with a ~5 mph increase in clubhead speed. The concept of delaying wrist release to increase clubhead speed has been suggested in computer simulation studies as well (Jorgensen, 1970; Sprigings & MacKenzie, 2002). Joyce (2017) found a strong correlation between lower trunk x-factor stretch and clubhead speed (r = 0.78, p < 0.01). So, golfers that increased the angular separation between the lower trunk and pelvis to a greater extent, after the start of the downswing, tended to produce more clubhead speed. While there are numerous additional factors that have been researched, arguably, the three factors just described, have had the strongest prevalence in mainstream golf instruction over the past 30 years (DeNunzio, 2016; Kaspriske & Foley, 2018; McLean, 1992). While these studies have provided important insights into the associations between various biomechanical variables and clubhead speed, it could be argued that a firmer understanding of the more direct causes of clubhead speed generation, from a deterministic standpoint, would be of value. In other words, delaying wrist release or increasing x-factor stretch does not guarantee an increase in clubhead speed. This is because these variables do not have a direct mechanical relationship with clubhead speed.
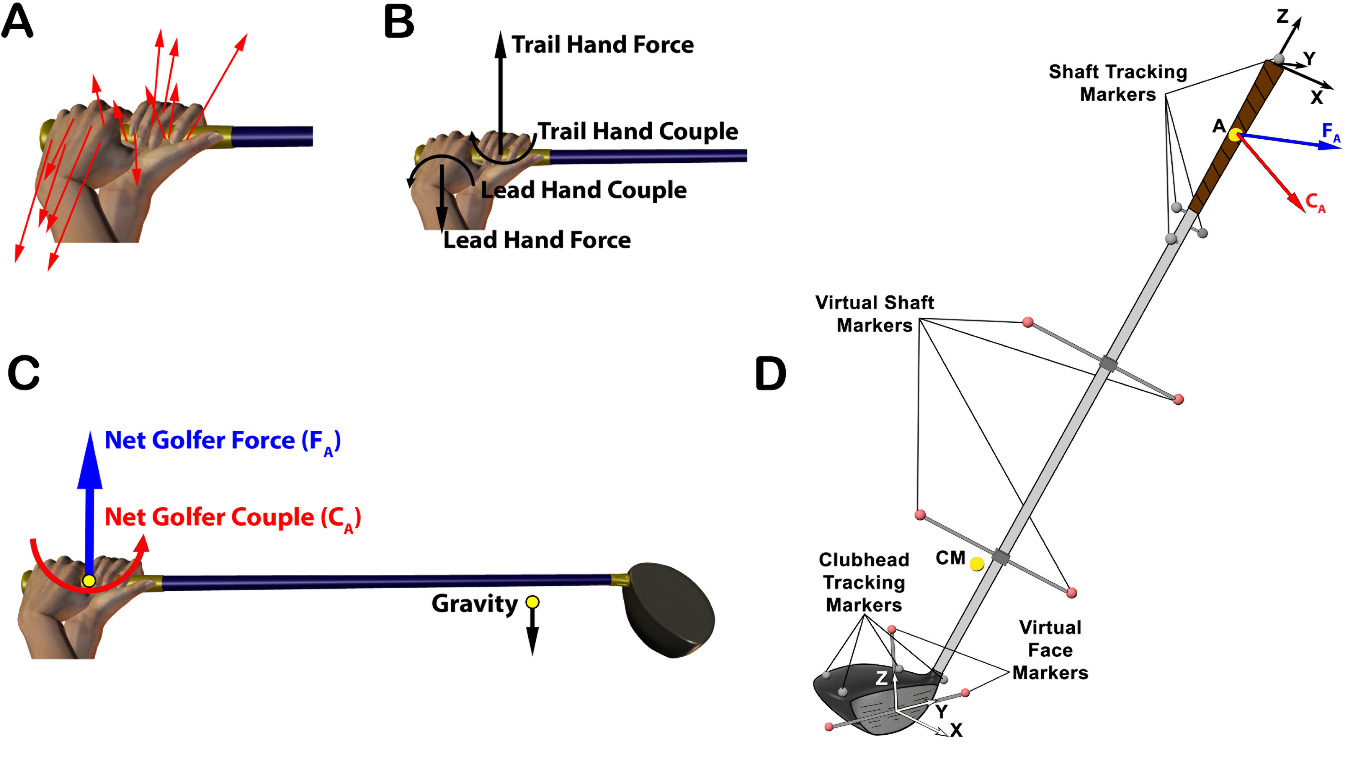
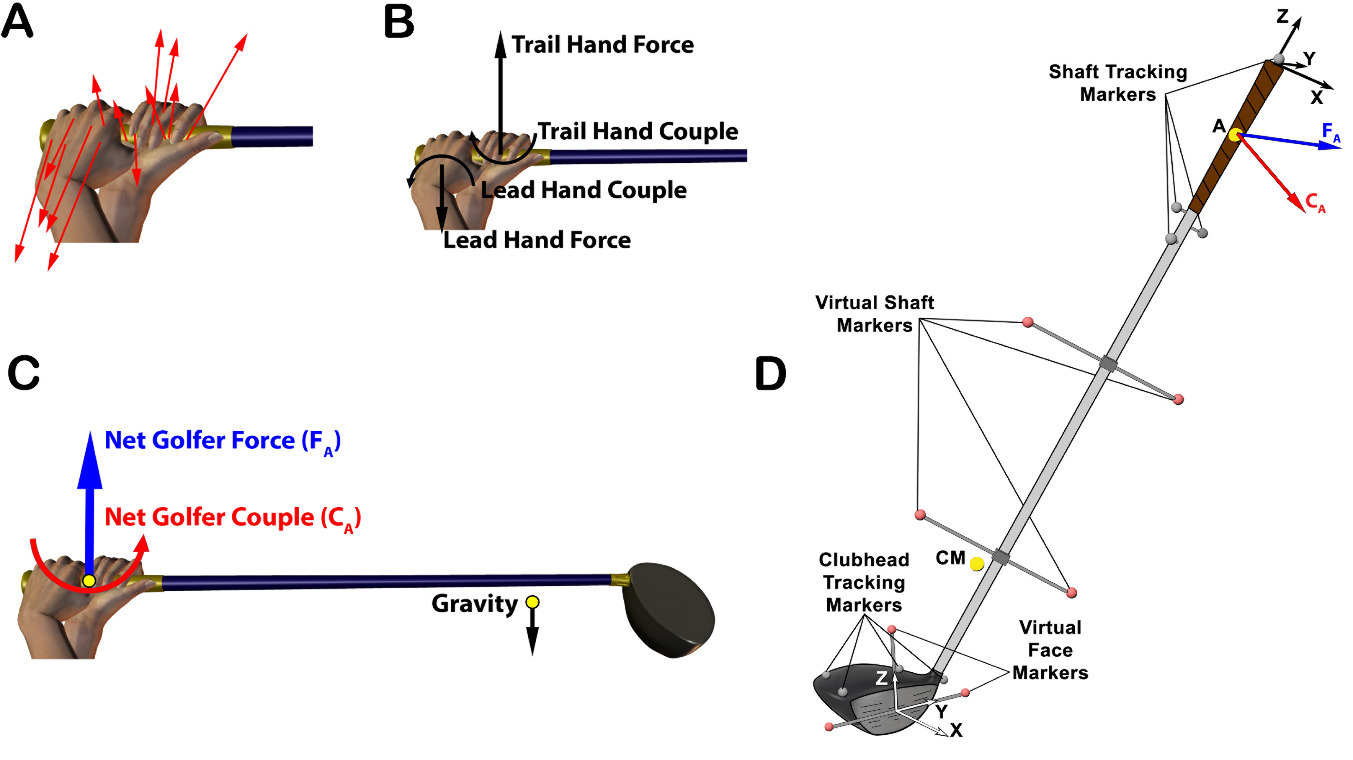
From a mechanical perspective, the external forces applied to an object determine the change in motion of that object. The majority of previous research investigating the forces applied to move sporting implements has been from an inverse dynamics perspective (Bahamonde & Knudson, 2003; Budney & Bellow, 1979; Horiuchi & Sakurai, 2016; Milanovich & Nesbit, 2014; Nesbit, 2005; Nesbit & Serrano, 2005; Vaughan, 1981). Typically, a Newton-Euler approach has been used and the system of forces applied to the implement by the athlete (Figure 1A) is replaced by an equivalent force-couple relationship (Kane, 1961; Zatsiorsky, 2002). This provides the researcher with a net force and a net moment (due to a theoretical couple) applied to the implement by the athlete (Figure 1C). Once the kinetics applied to the implement are determined, the work-energy theorem allows the calculation of the linear work done through application of the golfer-applied force and angular work done by the golfer-applied couple (Meriam & Kraige, 2012). Specifically, linear work is a function of the length of the golfer’s hand path and the net golfer-applied force in the direction of the hand path. The path of the hands refers to the trajectory traced out by a point on the grip (Figure 1) representing the location of force application from the golfer. Similarly, angular work is a function of the rotation of the club about the axis of rotation and the net golfer-applied couple about that axis.
Results from a study on 84 golfers suggest that, on average, amateur golfers perform approximately equal amounts of linear and angular work on the club and that better golfers tend to perform a higher amount of linear work relative to angular (Nesbit & Serrano, 2005). However, it is important to note that Nesbit (Nesbit, 2005) reported in his Table 4 that the total work done on the club by these 84 golfers only predicted 43.1% of the variability in clubhead speed among participants. It seems unlikely that gravity and air resistance (the only others source of external work) could account for the remaining 56.9% of the variability. This inconsistency suggests that further research into the sources of energy supplied to the club by the golfer is warranted. Further, there has also been no research into how the sources of work on the club account for the variability in clubhead speed within a population of golfers. For example, it is possible that golfers with disparate clubhead speeds perform similar levels of angular work on the club and that differences arise due to varying amounts of linear work. Further, if linear work is the differentiating factor, then how important is the magnitude of force applied along the hand path versus the length of the hand path? Having an understanding of the relative importance of each factor would be beneficial to golf instructors trying to improve clubhead speed. How much speed can a golfer expect to gain by increasing the length of their hand path by 10 cm or by increasing the angle through which they move the club on the downswing (i.e., should they bring the club past parallel on the back swing)? Therefore, the primary purpose of this study was to evaluate the relative importance of the four variables, under the control of the golfer, that are directly responsible for the transfer of energy to the club throughout the movement of a golf drive. From an inverse dynamics perspective, these four variables are: the length of the hand path, the force applied along the hand path, the angle the club is rotated through, and the couple applied about the axis of rotation.
2. Methods
2.1 Participants
Seventy-six (3 female, 73 male) right-handed golfers with handicaps less than 15 (handicap: 7.5 ± 5.3; height: 1.78 ± 0.1 m; mass: 84.3 ± 11.9 kg) volunteered to participate. The study was approved by the University’s Research Ethics Board, and testing procedures, risks, and time required were fully explained to each participant before they provided an informed consent.
2.2 Procedures
Participants performed a standardized golf warm-up consisting of dynamic stretches and swings of increasing intensity, which lasted approximately 5 minutes. Following this initial warm-up, participants hit 6 practice drives and were instructed to imagine that they were hitting for an equal balance of distance and accuracy, with their most typical shot shape (e.g., high draw), on a long par-4. A Doppler radar launch monitor (FlightScope X2) and ball flight simulation software (FlightScope Software V10.1, FlightScope Ltd, Orlando, FL, USA) were used to display a target, and resulting shot trajectory, onto a projection screen 7 m away. Following the practice drives, participants hit 12 test drives with 30 s of rest between shots. All swings were conducted with the same Ping G 10.5 driver head, set in the neutral face angle position. The driver was 1.15 m in length, had a total mass of .323 kg, a shaft frequency of 261 cpm, and a D3 swing weight. While having each participant swinging their own driver may have improved external validity, we do not believe it would have fundamentally changed the manner in which they generate speed.
A ballot system – for a chance to win a new custom fit driver – was implemented to incentivize participants to perform optimally on each drive. Following warm-up, participants were informed that they could earn a ballot for each of the 12 trials based on their individualized criteria for both clubhead speed and ball lateral finish location from the target line. A clubhead speed threshold was created by subtracting 2 mph from the average clubhead speed for their practice drives. A threshold for lateral error was created based on their clubhead speed threshold [lateral threshold (yards) = 0.33*clubhead speed threshold – 15]. So, a participant that averaged 102 mph in practice, earned a ballot for every trial with a clubhead speed over 100 mph and a lateral miss within ± 18 yards of the target line.
2.3 Data collection and processing
Golf club kinematics were collected using an 11-camera optical system (Raptor-E, Motion Analysis Corporation, Santa Rosa, CA, USA). Four tracking markers were placed near the grip end of the club to create a grip reference frame and four tracking markers were placed on the clubhead to create a clubface reference frame (Figure 1D). If ball contact was made with the lie, loft, and face angle equal to 0°, then the clubface reference frame would be perfectly aligned with the global reference frame. During a calibration trial, markers were temporarily placed on wands extending from the shaft in order to calculate virtual markers located within the length of the shaft. During this calibration trial, markers were also precisely placed on the face of the driver to create the clubface reference frame (Figure 1D). Camera shutter speeds were set to 1/4000 s, and data were sampled at 500 Hz. The software application Cortex (version 7.0, Motion Analysis Corporation, Santa Rosa, CA, USA) was used to generate and export the 3D coordinate data for each marker. The residuals reported by the system were < 1 mm and the accuracy (root mean square error when measuring a known distance) and precision (SD of the length of a rod) were approximately 0.3 mm. The distance between the toe and heel marker on the clubhead was recorded for every frame. The mean and standard deviation of this distance was then calculated for each trial. Trial 19 for Participant 20 had the highest standard deviation (0.5 mm) with an average distance of 92.5 mm. A bespoke software program was written in MatLab (version R2014a, MathWorks, Natick, MA, USA) to process the 3D coordinate data and compute variables of interest. Coordinate data were filtered using the ‘spaps’ function in MatLab, which employed a quintic spline with a tolerance setting (set to 0.001) and the ability to differentially ‘weight’ how closely the filtered data followed the captured data at different points in time. In order to mitigate the distorting influence of impact, the 18 frames prior to impact were given weighting coefficients of 100, while the 30 frames including and following ball contact were given weighting coefficients of 0.001. All other frames were weighted at 1. This resulted in the filtered data closely matching the measured data up until impact. The marker on the toe of the clubhead attained the highest speed and was visible by the least number of cameras (three) at certain points in the swing. The root mean square error (RMSE) between the raw and filtered position data of the toe marker for each frame of every swing was computed. Trial 10 for Participant 27 had the largest average RMSE (0.4 mm) during the swing.
The kinetics applied to the grip of the driver by the golfer were determined with a 3D inverse dynamics approach that utilized a Newton-Euler formulation. The same approach has previously been applied to determine golfer kinetics at the grip of a putter (MacKenzie & Henrikson, 2018). The rotational equations of motion were written with respect to the center of mass (CM) of the driver. The inertial properties of the driver (Table 1) were provided by the manufacturer based on computer-aided design software and were verified using industry standard measurement equipment (e.g., Auditor Golf Club MOI System, Technorama Co., Taiwan).
Symbols
FA Net force applied to the grip by the golfer
m Mass of the driver
acm Linear acceleration of the driver’s cm
CA Moment due to the net couple applied to the grip by the golfer
MA Moment due to the resultant net force applied to the grip by the golfer about the club cm
TA Total moment (torque) exerted on the grip by the golfer
α Angular acceleration of the driver
ω Angular velocity of the driver
g gravity (-9.81 m/s2)
Icm 3 × 3 inertia matrix about the center of mass of the driver
rA_cm Position vector from point A on the grip (10 cm from the butt) to the cm of the driver
FA+mg=macm(1)
where,
TA=CA+MA=Icmα+ω×(Icmω)(2)
MA=rA_cm×FA(3)
The linear work done on the club by the golfer was calculated by integrating the component of the golfer-applied force (FA) in the direction of motion of the mid grip (point A) with respect to the distance travelled by the mid grip during the swing. For the purpose of this manuscript, the travel of the mid grip point is considered the same as the ‘hand path’ and it is assumed to be the point of net force application by the golfer. The angular work done on the club by the golfer was calculated by integrating the component of the golfer-applied couple (CA) about the instantaneous axis of rotation (Chèze et al., 1998) of the club with respect to the angular rotation of the club about that axis. The work done by gravity was calculated by integrating the weight of the club with respect to the vertical displacement of the club’s center of mass. The kinetic energy in the club was determined by summing the linear and angular components. The strain energy stored in the shaft was estimated by assuming the shaft stored strain energy like a linear spring, SEshaft = ½KΔX2, (MacKenzie & Sprigings, 2009). Similar to MacKenzie et al. (2009), the K value of the shaft (200 N/m) was determined experimentally and the ΔX was calculated by determining the position of the hozel relative to that of a theoretically rigid shaft.
2.4 Statistical Analysis
Sequential linear multiple regressions were used to understand the predictive relationship between clubhead speed and the mechanical factors directly responsible for creating clubhead speed from a work-energy perspective. First, clubhead speed was regressed with linear work, angular work, and gravitational work. Following this, clubhead speed was regressed with the four variables that comprise the work done by the golfer during the downswing: hand path length, force along the hand path averaged over the length of the hand path, angular distance of the club about the instantaneous axis, and the couple about this axis averaged over the angular distance. In order to compare results to previous research by Nesbit, the work done during the downswing was of primary focus. The start of the downswing was defined as the point in time when the center of the face had the least speed. Statistical analysis was performed using SPSS V25.0 for Windows (IBM Co., NY, USA). Statistical significance was set at p < .05 for all tests.
3. Results
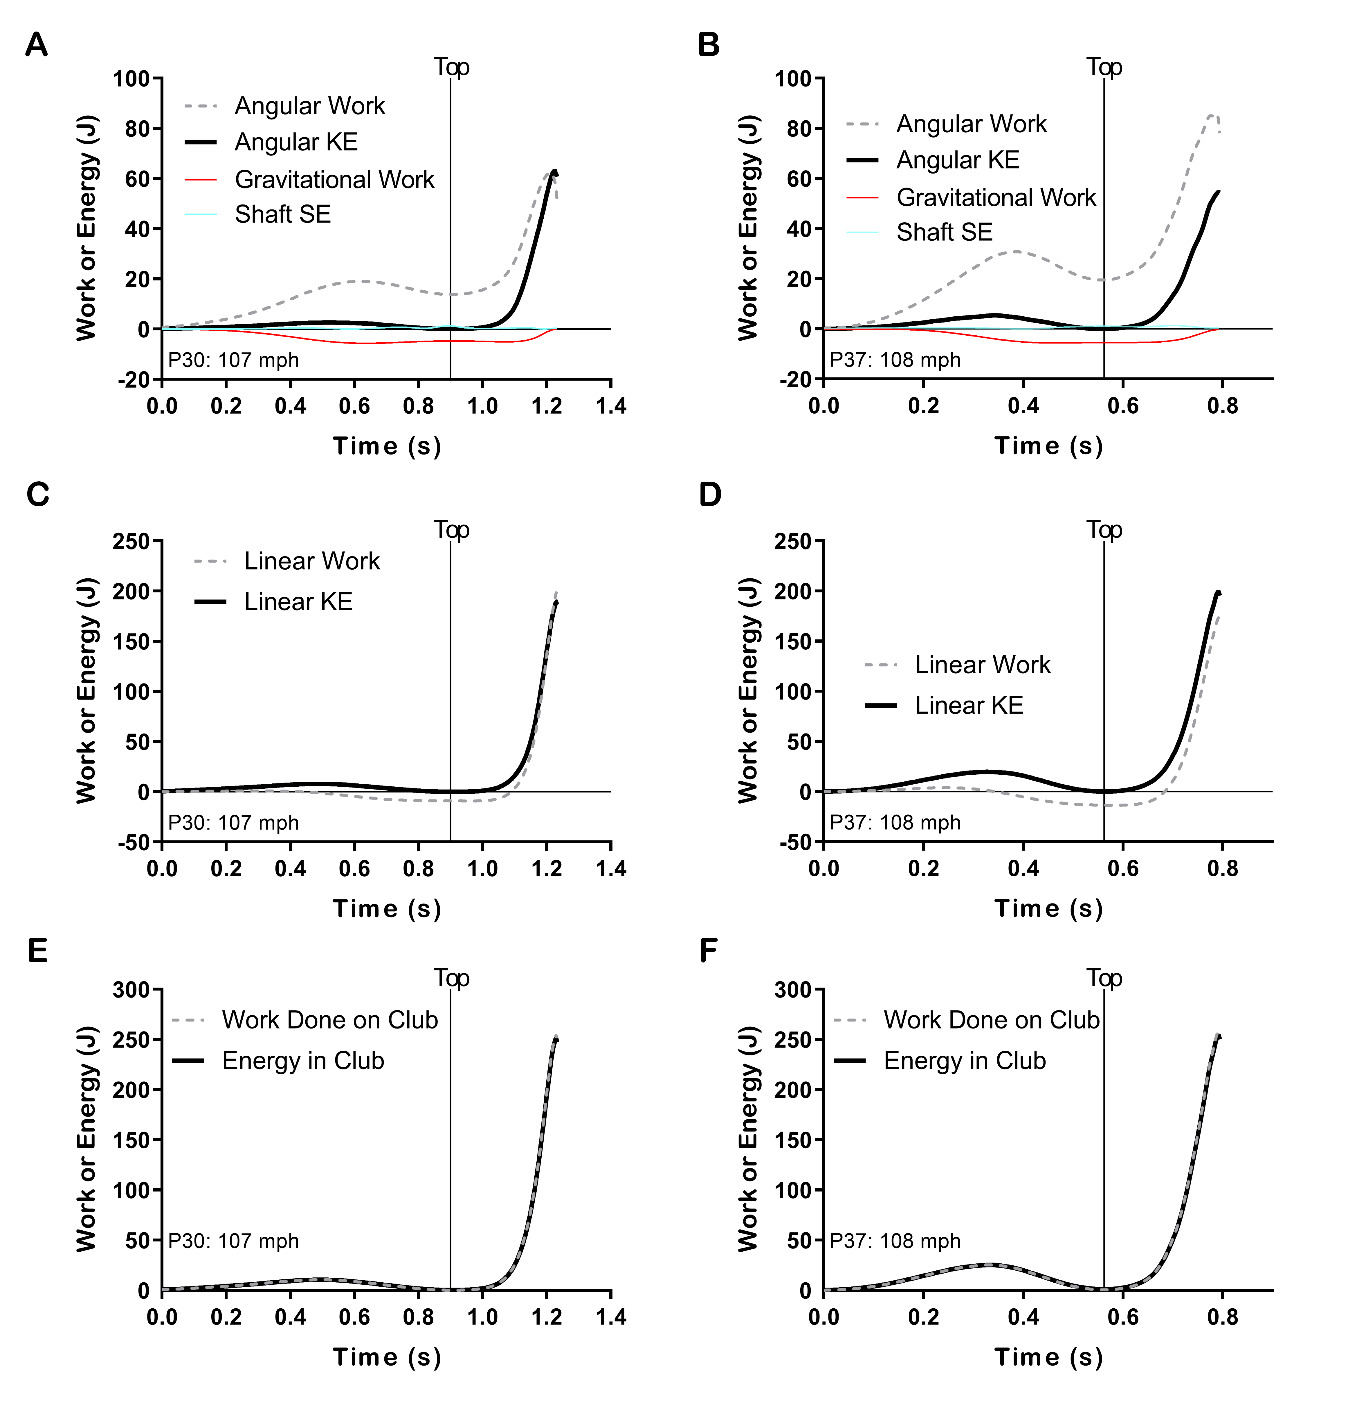
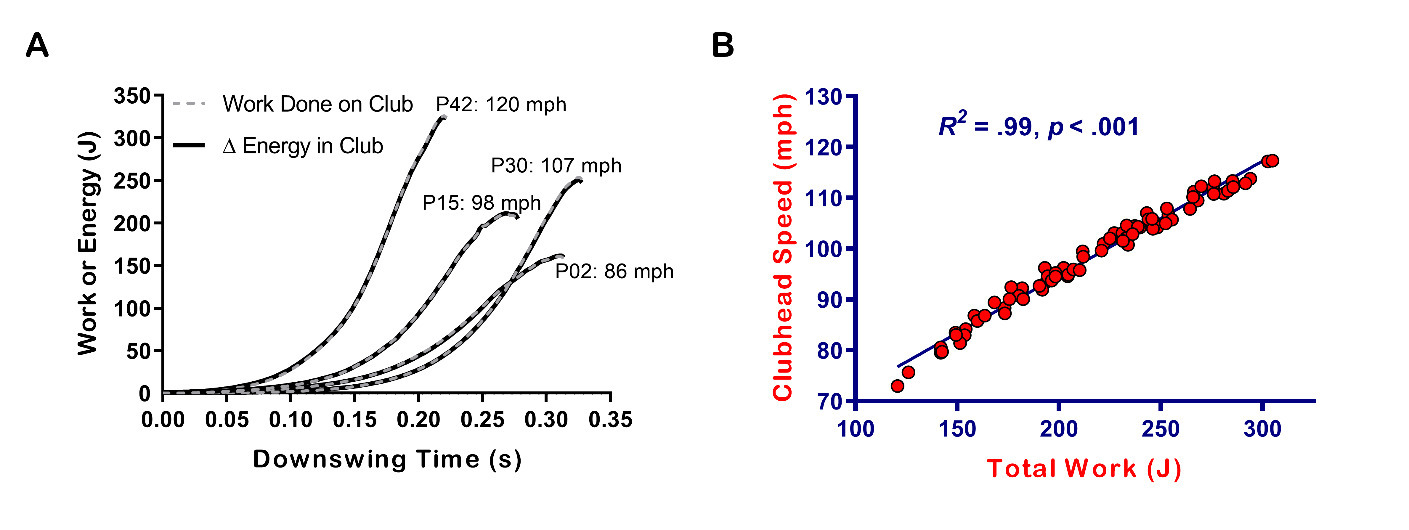
As would be expected, there was nearly a perfect alignment between the work done on the club and the change in club energy (kinetic and shaft strain energy) during the downswing (Figure 2A). On average, the participants did ~4.5x more linear work on the club (174 ± 40 J) relative to the amount of angular work (39 ± 14 J) throughout the downswing (Table 2). There was no meaningful association between this ratio and either handicap (r=.17) or clubhead speed (r = .16). The results of the regression of clubhead speed with the three sources of external work considered in this study demonstrated that the work done on the club by the golfer predicted virtually all of the variability in clubhead speed (R2 = .99) (Table 2). The linear work component alone predicted 90% of the variability in clubhead speed and had the largest unique contribution (sr2 = .58). Angular work predicted an additional 9% of variability, which was significant (p < .001), while gravitational work had no predictive ability (Table 2). It is worth noting that when the work done over the entire swig is used, there are no meaningful changes as linear work predicts 89% of the variability in clubhead speed while angular work predicts 9.7%.
The results of the regression of clubhead speed with the four factors that comprise the work done on the club by the golfer demonstrated that the average force along the hand path predicted 92% of the variability in clubhead speed and had the largest unique contribution (sr2 = .29) (Table 3). Hand path length and the average couple had very similar Pearson correlations with clubhead speed (r = .45), similar unique contributions (sr2 = .05 and sr2 = .04, respectively), and collectively predicted an additional 6% of the variability in clubhead speed over the average force. Angular distance did not have a significant Pearson correlation with clubhead speed (r = .14, p = .11) and did not contribute meaningfully to the model’s overall predictive ability.
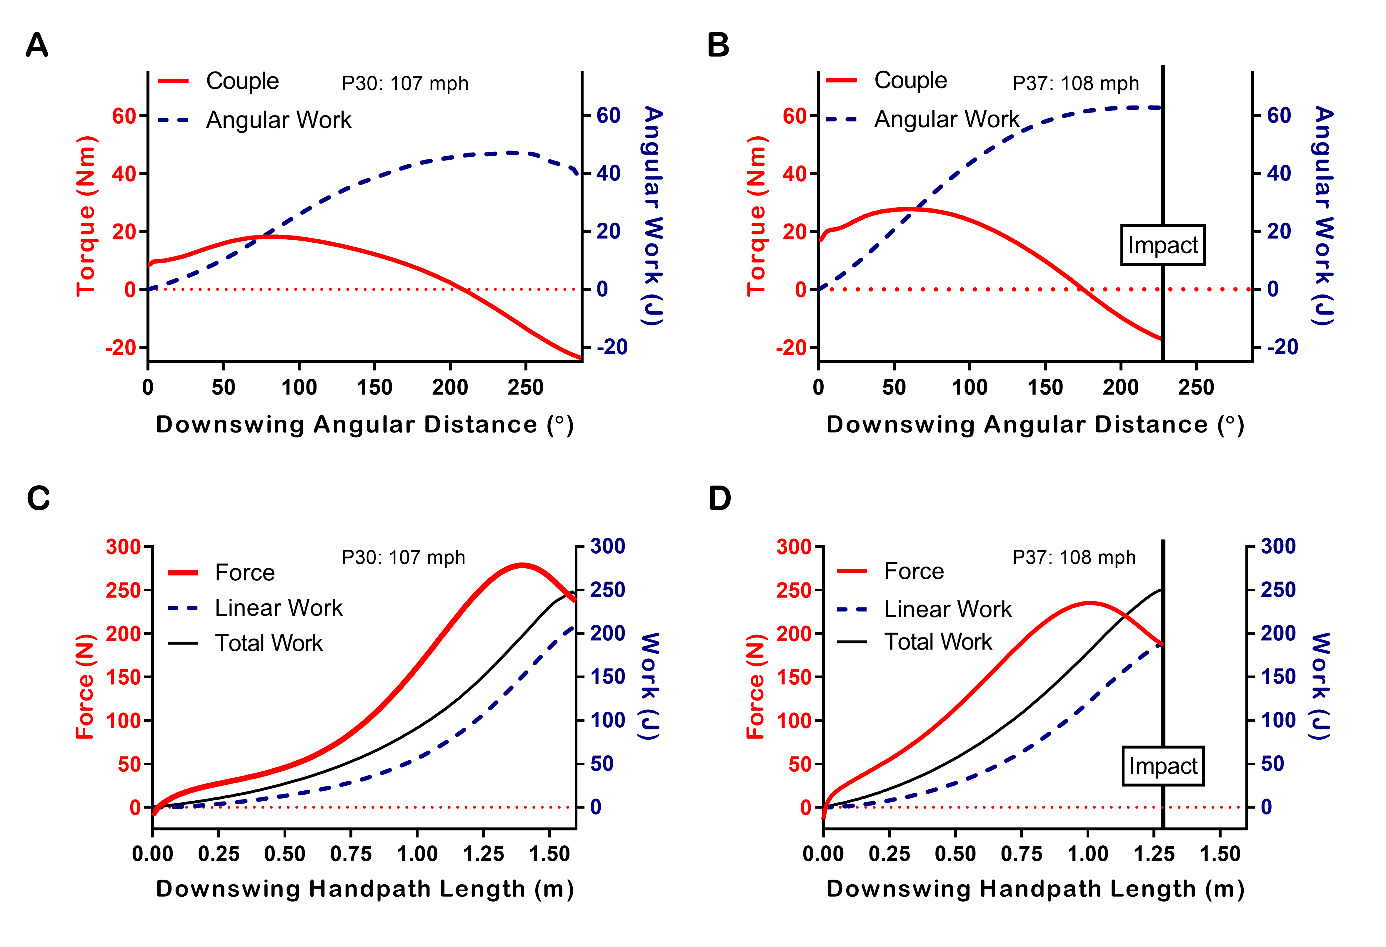
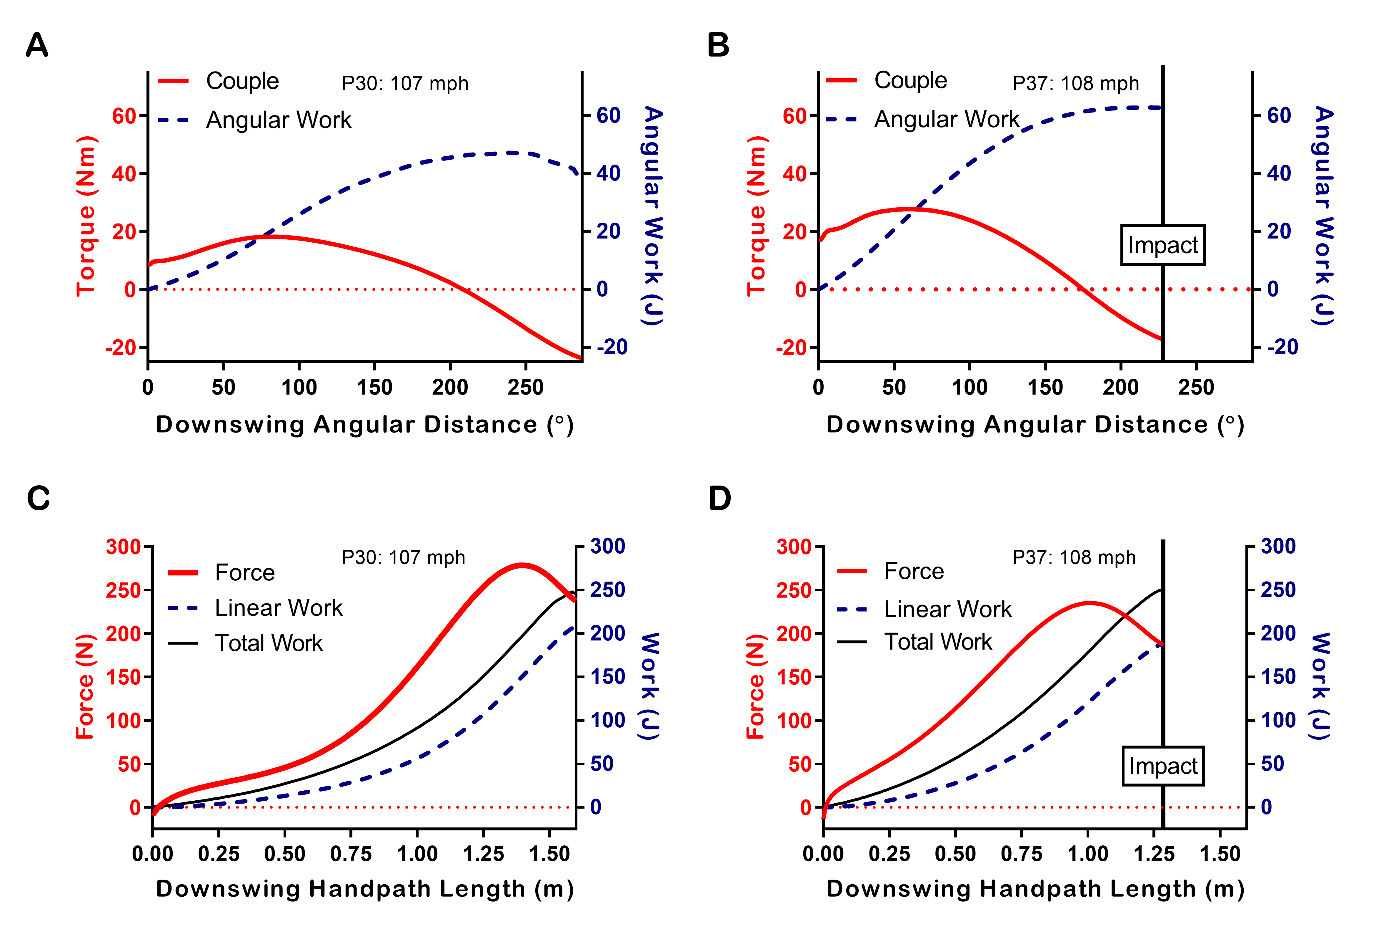
The cumulative area under the couple-angular distance curve (Figure 3A and 3B) equates to the amount of angular work done on the club by the golfer during the downswing. The couple tended to increase at the start of the downswing, peaked mid downswing, and became negative prior to impact. On average, angular work peaked ~ .03 ±.01 s before impact. The cumulative area under the force-distance curve (Figure 3C and 3D) equates to the amount of linear work done on the club by the golfer during the downswing. The force applied in the direction of travel of the hand path (point A, Figure 1D) tended to have the greatest rate of increase during the middle of the downswing, peaked just after the shaft was parallel to the ground for the last time, and then dropped slightly heading into impact (Figure 3C and 3D). Linear work peaked at impact for all participants, while total work done by the golfer tended to peak very close to impact. Participant 30 (left side of Figure 3) and participant 37 (right side) completed similar amounts of total work on the club resulting in similar clubhead speeds; however, they accomplished this in different ways. Participant 30 had an extra 0.32 m of hand path length, rotated the club through an extra 58°, did an extra 20 J of linear, and 24 J less angular work, relative to Participant 37.
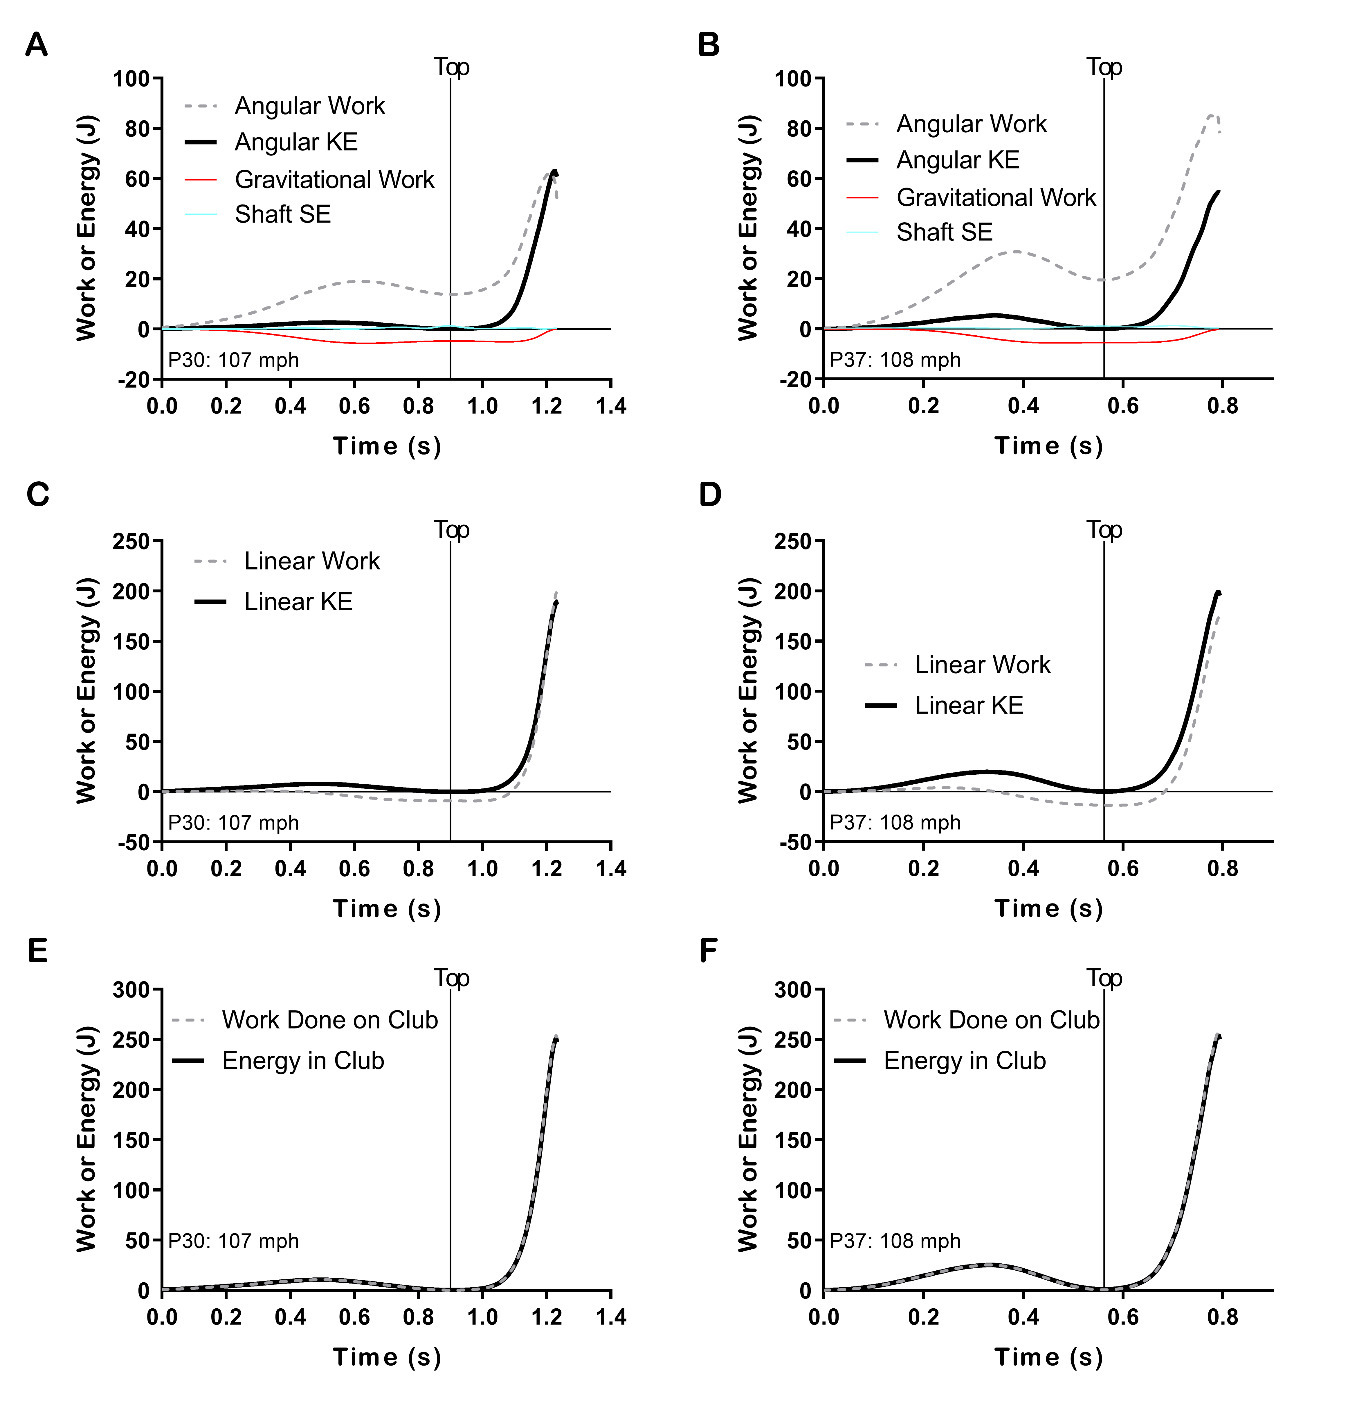
Participants 30 and 37 moved the club in the backswing by performing more angular work relative to linear work, with linear work actually being negative at the end of the backswing (Figures 4A-D). Raising the height of the club’s center of mass during the backswing resulted in gravity doing negative work on the club, while lowering the club during the downswing resulted in a nearly equal amount of positive work from gravity (Figures 4A and 4B). Shaft strain energy was found to be relatively small in comparison to the kinetic energies in the club (Figures 4A and 4B). At impact most swings were associated with less than 1 J of strain energy in the shaft and no swings were estimated to have more than 2 J in the shaft at impact. The maximum amount of strain energy, calculated at any point in the swing, from the participants in this study was found to be approximately 6 J. The total work done on the club and total kinetic and strain energy in the club matched very closely for all golfers throughout the entire swing (Figures 4E and 4F).
4. Discussion
Work done by the muscles during the swing adds energy into the golfer-club system. The more energy the golfer can transfer to the club, the greater the potential for improved performance with the driver. The golfer does work on the club – changing the kinetic energy – by applying forces to the grip with both hands. Since the golfer and club form a closed-loop system (Vaughan, 1981), the individual hand forces are not known (unless the grip is instrumented) and the resulting kinetic output from an inverse dynamics analysis is a net force and a net couple applied by the golfer.
The net force was assumed to be applied at a point on the grip in the middle of the hands (Figure 1). The component of the net force applied in the instantaneous direction of travel of this point, along with the distance this point travels, determines the linear work done on the club by the golfer. The angular work is a function of the amount of rotation the club undergoes about the instantaneous axis of rotation, along with the component of the couple directed about this axis. The primary purpose of this study was to determine the relative importance of the various components of the work done, on the driver by the golfer, in predicting variability in clubhead speed among a group of amateur players. It was determined that linear work predicted 90% of the variability in clubhead speed, while angular work only predicted an additional 9%, and gravity had no predictive ability.
The average force applied in the direction of travel of the hand path was by far the biggest discriminator in separating individuals with different levels of clubhead speed, as it predicted 92% of the variability. From a practical standpoint, knowing that a higher level of average force most likely explains differences in clubhead speed does not suggest a clear path for an instructor, or golfer, trying to increase clubhead speed. The reason is that a higher average force could be the result of several diverse factors such as swing coordination, level of exertion, and the force generating capabilities of the primary muscles involved.
The coordination of the swing refers to the profiles of muscle activation that produce the subsequent motions of the body segments. This is a complex space in itself and is likely where most efforts are spent in the search for increased clubhead speed. One example of how coordination would influence the average force applied to the grip would be the sequence with which the activation levels of the primary downswing muscles are increased during the transition from the backswing. The influence of coordination patterns on the work done by the muscles in changing the kinetic energy of the center of mass have led to a deeper understanding of optimal jumping mechanics (Bobbert & Van Soest, 2001) and a similar treatment of the golf swing would be a worthy future endeavor.
Level of exertion refers to the percentage of maximum effort with which the golfer is currently swinging. This can be thought of as a ‘scaling’ in the level of the profiles of muscle activation for a given pattern of coordination. For example, Jordan Spieth (winner of three Majors), stated that he consciously tries to swing at less than maximum with the driver to maintain control (Spieth & Adler, 2018). Further, consider a golfer that adjusts from a complete pause at the end of a very slow backswing, to a very dynamic transition at the end of a high velocity backswing, but reaches the same position at the top. During the ‘fast backswing’ swing, the relevant downswing muscles would be stimulated earlier in the backswing motion leading to a higher activation level (higher force) at the start of the downswing and the potential for more work to be done. The force from a muscle depends on its activation level (the fraction of engaged contractile elements) and it takes time to develop the activation level (Bobbert & Van Soest, 2001). If the downswing muscles were stimulated earlier, and to the same degree in the ‘slow backswing’ swing, then the same top of backswing position would not be reached.
The force generating capabilities refers to features such as the rate at which muscle tension can be increased (and decreased) as well as the peak tension that can be developed. The genetic predisposition as well as the current level of trained conditioning of the golfer would both influence these muscle properties. Given a specific coordination pattern and level of exertion, the golfer with superior force generating capabilities would apply a greater average force to the grip during the downswing.
The length of the hand path was arguably the next most important predictor as it uniquely accounted for a significant amount of the variability in clubhead speed (sr2 = .05), which was slightly higher than that of the average couple (sr2 = .04). The regression analysis conducted in this study can facilitate a practical understanding of how much each predictor influences the dependent variable. Standardized coefficients (Beta in Table 3) refer to how many standard deviations a dependent variable will change, per standard deviation change in the predictor variable. For example, Beta for hand path length was 0.25 and the standard deviation was 0.12 m (Table 3). Therefore, if hand path length increased by 0.12 m, then clubhead speed would be expected to increase by approximately 2.7 mph (0.25*10.7). So, a player at 90 mph would be predicted to have their clubhead speed increase to 92.7 mph, if their hand path length increased from 1.30 to 1.42 m. Hand path length can be increased by having one or more joints increase their range of motion in the backswing. For example, rotating the pelvis more in the backswing, perhaps by allowing the lead heel to lift off of the ground, would give the muscles in the legs more potential to add energy into the system. Similarly, adding torso rotation would increase hand path length and allow the larger muscles that longitudinally rotate the upper body to do more work.
The angular distance through which the golfer rotated the driver predicted an insignificant amount of variability in clubhead speed, which might seem unintuitive. As a possible explanation, consider two golfers (A and B) with identical joint configurations at the end of the backswing and with the club shaft parallel to the ground. Golfer A makes an adjustment and increases her ‘wrist cock’ (i.e., lead wrist radial deviation and trail wrist extension), which adds an additional 20° to club rotation, but a negligible amount to hand path length. This new position primarily gives the relatively weak wrist muscles an increased ability to add energy into the system, which may not be meaningful. Further, if Golfer B adjusted to increase her ‘wrist cock’ angle by 20°, after the start of the downswing, it would allow for a faster stretch in the wrist muscles later in the motion, which would potentially provide an even greater contribution from the wrist muscles relative to Golfer A’s adjustment, but would not increase the total rotation of the club from a work-energy perspective.
Another factor also contributed to the low predictive value of angular distance in this study. There were six participants with below average clubhead speeds that rotated the club over 300° during the downswing (study average was 266°). These players would start the downswing with large amounts of ‘wrist uncocking’ that wouldn’t add a meaningful amount of energy to the club. These players would be referred to as ‘casters’ in the popular golfing literature. Further, increasing hand path length via increased joint rotations in the backswing (e.g., torso longitudinal rotation), can increase the club’s angular distance. As such, increasing club angular distance with joint rotations other than the wrists, may not add any unique predictive ability that’s not accounted for by hand path length. To be clear, adding angular distance certainly increases the potential for clubhead speed. This seems self-evident from watching long drive competitions. However, realizing this potential may require an above average level of coordination, significant practice time, and/or elite muscle properties.
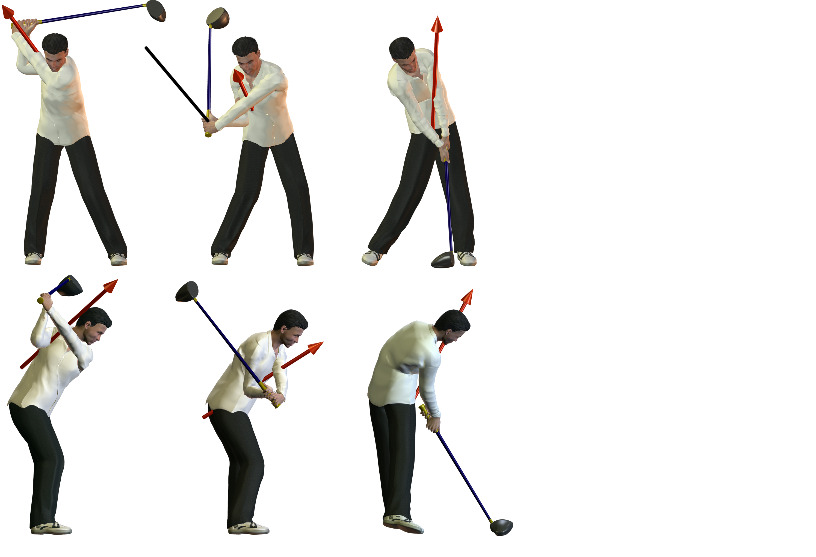
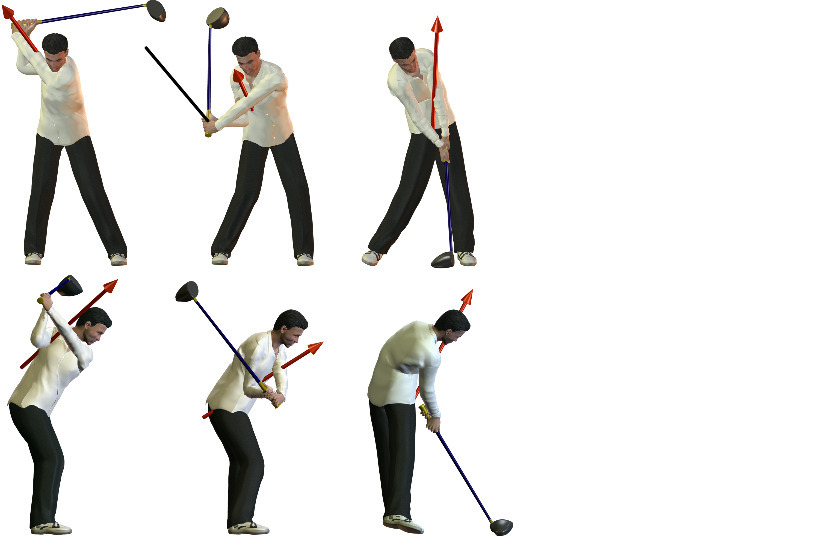
The angular distance travelled about the instantaneous axis can be a challenging concept. For the most part the vast majority of this angular motion, associated with the work done by the couple, is about an axis approximately perpendicular to what could be considered the swing plane as reported by high-end radar launch monitors (Figure 5). As impact approaches the club attains a high rate of angular velocity about the long axis of the shaft and the instantaneous axis of rotation points more in-line with the shaft to reflect this; however, the couple about the long axis of shaft is not large, so the majority of the angular work done on the club remains in the plane of the swing.
Although statistically significant and somewhat meaningful, the couple applied about the instantaneous axis had far less predictive power than the force applied in the direction of the hand path. Having the couple become negative over the final 30 ms of the downswing is likely not advantageous, and although the golfer would theoretically benefit from maintaining its positive direction, it does not seem to be easily accomplished. The ability of a golfer to apply wrist joint torques and trail elbow extension torque would be key to maintaining a positive couple, which is challenging considering these joints have angular velocities over 600 °/s (potentially over 1000°/s) during the final 30 ms of the downswing for a mid-handicap golfer (Zheng et al., 2008). Koike et al. (2006) instrumented the grip of a golf club and were able to report individual hand forces and couples from the swing of a professional golfer. The results support the findings from this study, in that the individual hand forces produced a negative couple in the plane of the swing late in the down swing. Later in the downswing the lead hand couple also became negative, while the trail hand couple hovered just above zero prior to impact. It is important to note that a negative couple does not mean that the club’s angular acceleration becomes negative about the instantaneous axis. Every participant in this study continued to increase the angular velocity of the club after the couple became negative. The torque due to the couple is only part of the total torque applied to the club by the golfer. The net force applied to the grip will also generate a moment of force (MA, Eq. 3) when the line of action of this force does not pass through the center of mass of the club. This moment of force has a strong tendency to be positive late in the downswing and was responsible for the club’s continual increase in angular velocity about the instantaneous axis until impact.
From a practical standpoint, it is important to consider that the couple applied to the grip by the golfer is not controlled independently of the net force applied by the golfer. In other words, there is not a series of actions that would allow the golfer to change the applied couple without also changing their net force during an actual golf swing. Consider that the application of a pure couple - to the grip of an initially motionless club - would result in the club rotating around a stationary center of mass. Any golfer action that changes the velocity of the club’s center of mass is a clear indication of a golfer-applied net force. Even the golfer-applied kinetics associated with isolated wrist rotations will accelerate the club’s center of mass.
It was determined that for any given golfer, the amount of linear work was multiple times that of the angular work done on the club, while gravity contributed on average 2% to the total amount of work done during the downswing. Participant 42, a scratch golfer with a clubhead speed of 117 ± 1.3 mph, had the highest angular work value of 79 ± 4 J. Nesbit (2005) reported that a scratch golfer with a similar clubhead speed (116 mph) completed far more angular work at approximately 140 J (see his Figure 9). All of Nesbit’s reported angular work values are at least 40 J higher than the highest value in this study. The highest amount of angular work reported by Nesbit was 148 J by a 13 handicap male with 103.7 mph of clubhead speed, and a linear work amount of 140 J (linear/angular work = 0.95). There were 20 participants in this study within ± 3 mph of 103.7; yet, their angular work values ranged from 20 J to 60 J. Given the similar nature of the participants between studies it seems likely that these large discrepancies in angular work were due to differences in methodology.
The validity of the methods used in this paper are primarily supported by two findings. First, the calculated work done on the club matched the change in energy of the club during the swing, which is in accordance with the work-energy theorem (Figures 2 and 4). To the contrary, for example, Nesbit’s 5H and 13H participants generated nearly identical total work values of 289 J and 288 J, respectively, but the peak kinetic energy in their clubs differed by 38 J. Second, in this study, the total work done on the club by the golfer predicted 99% of the variability in clubhead speed, which makes sense since gravitational work contributed little and was similar between participants. To the contrary, Nesbit (2005) reported that the total work only predicted 43.1% of the variability in clubhead speed (see his Table 4). It seems likely that only methodological differences (e.g., data processing) could account for the 56.9% of unexplained variance. As one example, the speed of the hands (mid grip point) is central to the work calculations. Nesbit (2005), states that unlike previous researchers (Cochran & Stobbs, 1968; Vaughan, 1981), he did not report a significant reduction in hand speed prior to impact. In fact, according to Nesbit’s Table 3, the median peak hand speed occurred exactly at impact (meaning hand speed peaked after impact for half his participants). Vaughan (1981) showed hand speed peaking 60 ms before impact. Osis & Stefanyshyn (2012), showed a graph of hand speed peaking ~80 ms before impact and dropping by ~25 % at impact. On average in this study, hand speed peaked approximately 70 ms before impact and dropped by ~23 % at impact. The black line in top middle image of Figure 5 shows the approximate position of the shaft at 70 ms prior to impact. Collectively, this suggests an issue with how Nesbit processed the positional data (perhaps over smoothing), which would influence all subsequent calculations (e.g., angular velocity, force, work).
The height of the club’s center of mass at the start of the downswing (relative to its height at impact) determines the work done by gravity during the downswing. Players that had longer hand paths and more club rotation tended to start the downswing with the center of mass vertically closer to the location at impact (club shaft past horizontal with the clubhead below the hands), which resulted in a negative correlation between gravitational work and clubhead speed (r = -.07, p = .27). For example, gravity did 4.4 J of work during P30’s downswing and 5.3 J during P37’s. P30 had a longer hand path and more angular distance (Figure 3), which put the club’s center of mass closer to the ground at the start of the downswing. Further, when considering the backswing and downswing, since the club center of mass is typically higher above the ground at impact, than at address, gravity tends to do a net negative amount of work on the club during the swing (Figures 4A and 4B). It is possible that if the total work done on the club and arms by gravity was considered, – and a meaningful amount of this energy made it to the club at impact – then gravity’s role could be marginally improved.
The golf swing is frequently referred to as a ‘rotational’ skill, which is understandable considering many segments – the club in particular - rotate through large ranges of motion, while the golfer’s center of mass typically only translates a few inches. As such, it may seem unintuitive that linear work was found to far exceed angular work in this study. Although not part of this study’s analysis, it is worth noting that the angular impulse, due to the total torque (TA) applied in the plane of the swing during the downswing, predicted 91 % of the variability in the clubhead speed. So, from an impulse-momentum perspective angular kinetics have a very high predictive ability.
Two key factors result in the work-energy approach softening the importance of angular kinetics relative to the impulse-momentum approach. The first is that only CA contributes to angular work, while TA (CA + MA) contributes to angular impulse. The second is that only an angular impulse can generate angular momentum, while both linear and angular work can contribute to angular kinetic energy. During the backswing, angular work performed on the club can far outpace the change in angular kinetic energy (Figures 4A and 4B). Similar, the linear work done, and change in linear kinetic energy will not be equivalent throughout the swing (Figures 4C and 4D); yet, the total work done will equal the change in energy (Figures 4E and 4F).
Consider a golf club fixed to a pivot - like a planar pendulum - about an axis through the grip end. Two forces act on the club: A contact force at the motionless pivot point and gravity at the translating center of mass. From a work-energy perspective gravity does all the work, and more specifically, all the work done by gravity is linear. Yet, that linear work manifests itself in both linear and rotational kinetic energy in the club. The force at the fixed pivot does no work on the club. From an impulse-momentum perspective, the combined linear impulses of gravity and the force at the pivot equals the change in linear momentum, while the angular impulse – due to the moment of force from the force at the pivot – equals the change in angular momentum. To be explicit, from a work-energy perspective gravity is responsible for all change in angular kinetic energy of a pendulum, while from an impulse-momentum perspective, the force at the pivot is responsible for all change in angular momentum. One benefit of explaining the mechanical sources of clubhead speed using work-energy versus impulse-momentum is that you can avoid the paradoxical thought of increasing clubhead speed by increasing the length of time of the downswing. Consider Figure 2A, participant 42 attained the highest clubhead speed with a downswing time that was shortest in duration. More time allows for more impulse, yet higher average kinetics will decrease downswing time.
Application
This study has provided novel insights into the understanding of how amateur golfers deliver energy to the driver and what differentiates golfers with varying levels of clubhead speed. Individual golfers do multiple times more linear work, relative to angular work, during the golf swing and linear work also accounts for the vast majority of differences in clubhead speed between golfers. Methods of training that increase the average force applied in the direction of the hand path during the down swing have the greatest probability in generating increases in clubhead speed. From a more practical standpoint, results from this study suggest that for amateur golfers, increasing the length of the hand path is more likely to increase clubhead speed than rotating the shaft through a larger angle. Future research should focus on the reasons why golfers of similar physical abilities are able to generate different levels of force in the direction of the hand path during the downswing.