


I. Introduction
The relationship between weather and sports can be divided into effects on sports performance and spectators at sporting and other events (Maunder, 1970). The impact of weather on sports performance varies greatly depending on the characteristics of the sport. It is mainly categorized into indoor and outdoor sports, with outdoor sports being greatly affected by the weather (Thornes, 1977). Among outdoor sports, golf is significantly affected by weather because competitions last for a long time (approximately 4 h). Furthermore, in stroke play competitions with more than 100 participants, start times may vary by more than two hours because it is impossible to start all players at the same time except in a shotgun start format. As time progresses, the possibility of weather changes increases, potentially creating favorable or unfavorable conditions for the players. Thornes (1977) describes golf as a “weather advantage sport” in which players are subject to “unequal interference.”
Weather conditions that may affect golf play include air temperature, wet-bulb temperature, relative humidity, wind speed and direction, sea level pressure, and precipitation. Among these, the effect of wind on golf holds special significance, as it has made the game both challenging and interesting throughout history and across all countries. Charles B. MacDonald (1855–1939), who helped found the United States Golf Association (USGA) and is often referred to as “the father of American golf course architecture,” described wind as the “finest asset in golf” and wrote that wind is the most delightful accompaniment to the game. Syunsuke Kato (1933–2018), who designed more than 70 courses in Japan and abroad, wrote “No Wind, No Golf” and stated that the enjoyment of the game was accompanied by wind. Therefore, research has also been conducted on the relationship between golf and wind. A study on the relationship between scores and weather conditions at The Masters, one of the four professional men’s majors, found that wind speed and direction were the most predictive weather factors for scores in the third and fourth rounds (Jowett & Phillips, 2023). The wind has the greatest effect on a player’s airborne shots, particularly with strong crosswinds, headwinds, and tailwinds. Players must consider the effect of wind on their shots (Malik & Saha, 2021). Headwinds and tailwinds affect the ball differently, with headwinds having a greater impact on distance than tailwinds, decreasing the carry distance, increasing the apex point of the ball, and increasing the landing angle to the green. However, with tailwinds, the highest point of the ball is lower than that of no-wind conditions, the landing angle on the green is smaller, and the ball rolls farther upon landing (Malik et al., 2018). Additionally, the drag force on the ball increases rapidly with speed. As the ball moves faster through the air, the resistance it faces increases exponentially. For example, if the speed doubles, the drag force increases by four times. This makes it important for players to consider wind conditions when planning their shots.
Research on the effects of wind has primarily focused on airborne images. In contrast, very few studies have investigated the effect of wind on putting, where the ball rolls on the ground. The typical number of putts for a PGA Tour golfer over 18 holes is 29, whereas golfers with an average score of 90 have an average of 33 putts (Broadie, 2014). Putting is an important shot, accounting for approximately 40% of golf scores (Pelz & Mastroni, 2004). Therefore, putting has been extensively studied. Elite players have reported that green reading is the most important factor in the variability of putting distance (Karlsen, 2010). The factor that determines direction is the orientation of the clubface at impact, which accounts for approximately 80% of the ball’s initial direction (Karlsen et al., 2008). However, a study that investigated the external factors affecting putting performance evaluated the uniformity of green surfaces and reported that surface irregularities affected putting performance (Linde et al., 2017). However, the effect of wind, which is one of the external factors that determine putting performance, has not been investigated.
Therefore, this study focused on the effect of wind and other external factors that are considered to affect putting performance, specifically weather conditions. Wind may cause air movement on the green, impacting the ball’s roll on the putting surface, resulting in errors in direction and distance, similar to airborne shots. Therefore, in this study, we aimed to investigate the difference in the stopping position of the ball due to variations in wind speed and direction between headwind, tailwind, and crosswind under artificially generated wind speeds of 2 and 4 m/s and to determine the effect of wind on putt distance and line for both wind speeds an indicator of green reading under windy conditions.
II. Methods
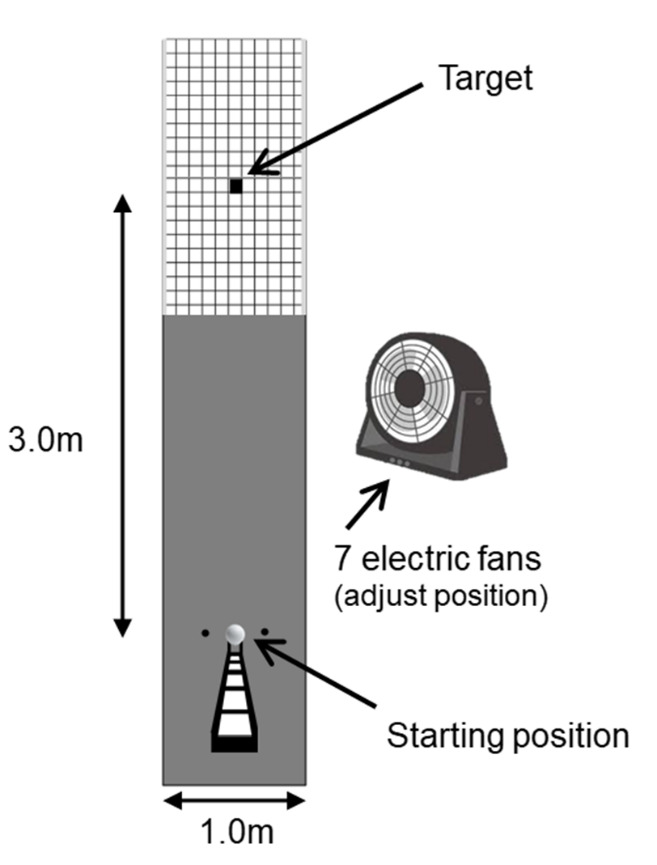
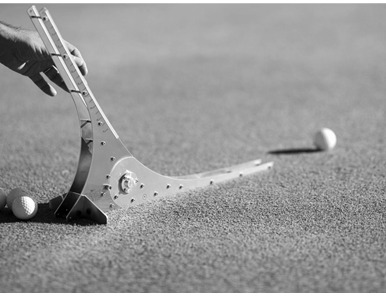
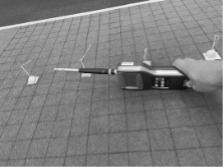
In this experiment, the spread test, originally used to evaluate the uniformity of greens, was applied to investigate the effect of wind on rolling balls. The spread test evaluates the uniformity of a green surface by rolling several balls from a specific distance using a ramp, recording their stopping positions, and calculating the spread variance (Linde et al., 2017). In this experiment, a 5.0 m x 1.0 m artificial turf putting mat was set up on a flat indoor surface with a floor slope of 0.5 degrees or less; the target was set at a 5 cm square in the center, and an inclination table was fixed at the starting point 3 m away and adjusted to ensure that the rolled ball stopped at the target in windless conditions (Figure 1). The indoor facility was maintained windless, with a wind speed of 0.1 m/s or less. The tilting table used in the experiment was the Perfect Putter®, designed with a gentle slope at the ball launch exit compared to a standard stimpmeter, minimizing errors caused by ball bounces near the exit (Figure 2). The artificial turf putting mat used in the experiment (Super Bent Putting Mat, Japan) was high-speed and of high quality, measuring 12 feet (approximately 3.6 m) as measured by the stimpmeter, which minimized irregular rolling (Figure 3). The error distance from the target was measured using a 5 cm square matrix grid marked on the artificial turf (Suzuki et al., 2019). For wind generation, seven blowers (electric fans) were used. The Taft method, an easy way to visualize wind direction (Steinfurth et al., 2020), was employed to confirm the wind direction by placing cotton tufts at 25 locations every 15 cm (Figure 4). An anemometer was used to measure wind speed at 12 locations every 30 cm for 5 s, and the position and direction of the blower were adjusted to be within ±0.3 m/s of the set wind speed. A thermal anemometer (Climomaster Anemometer 6501 Kanomax), capable of accurately measuring even low wind speeds, was used (Figure 5). This device is accurate to ±2%, making it highly reliable for research applications (Kanomax, 2024). The wind direction and speed were measured at a height of 5 cm from the artificial turf surface, corresponding to the rolling height of the ball.


Measurement conditions: The stopping positions of 20 balls under each of the following seven conditions were recorded: In this study, efforts were made to reduce the “tracking effect” (the phenomenon of balls leaving marks on artificial turf when rolled repeatedly) (Rana & Askew, 2018). To address this issue, a vacuum cleaner was used after every five balls were rolled to maintain a flat surface.
No Wind (Reference)
②Crosswind (Right-to-left) 2 m/s ③Headwind 2 m/s ④Tailwind 2 m/s
⑤Crosswind (Right-to-left) 4 m/s ⑥Headwind 4 m/s ⑦Tailwind 4 m/s
Measurements: The error distance from the target was measured using 5 cm matrix grid lines marked on the artificial turf mat. The average error distance from back to front was calculated for 20 trials (1. Distance Error). The same was calculated for the left and right errors concerning direction (2. Direction Error).
Statistical processing: Multiple comparisons of the subtests were performed after a two-way analysis of variance for wind speed (2 and 4 m/s) and wind direction (crosswind, headwind, and tailwind). The statistical significance level was set at 5% or less (SPSS 28.0; IBM Corp.).
III. Results
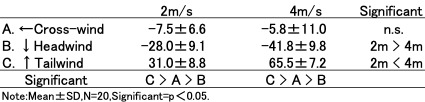
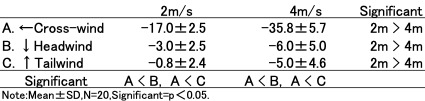
Figure 6 shows the average ball stopping position and standard deviation for the no-wind condition and each wind speed and direction. In the no-wind condition, the average stopping position of the ball was 0.0 ± 5.5 cm in distance error and 0.5 ± 1.5 cm in direction error, which was a slight error from the target in the no-wind condition; however, the ball nearly stopped at the center. In wind conditions other than the no-wind condition, the ball stopped significantly farther from the center, clearly demonstrating that wind influences the ball’s stopping position, at least on the green. The statistical results for distance error due to wind direction at wind speeds of 2 m/s and 4 m/s are presented in Table 1. Distance errors were significantly different between wind speeds of 2 m/s and 4 m/s for headwinds (-28.0 ± 9.1 cm versus -41.8 ± 9.8 cm) and tailwinds (31.0 ± 8.8 cm versus 65.5 ± 7.2 cm). The statistical results for the directional error due to the wind direction at wind speeds of 2 and 4 m/s are presented in Table 2. The directional error was significantly different between wind speeds of 2 m/s and 4 m/s during crosswinds (-17.0 ± 2.5 cm vs. -35.8 ± 5.7 cm). Surprisingly, directional errors were also observed between wind speeds of 2 m/s and 4 m/s, with small but significant differences in means for headwinds (-3 ± 2.5 cm vs. -6.0 ± 5.0 cm) and tailwinds (-0.8 ± 2.4 cm vs. -5.0 ± 4.6 cm). This was considered to be due to the use of seven small blowers in this experiment, which made it difficult to generate wind perfectly parallel to the target direction under headwind and tailwind conditions.
.png)

IV. Discussion
In this study, we examined the effect of wind on ball roll on a putting green in a stable indoor artificial turf environment, a question that has not been previously studied. Until now, golfers have empirically understood that wind affects them even when putting on the green, and they have relied on the wind speed and direction they experience when reading the green. Alternatively, low-skilled players may not consider the effect of wind on the putting green. Wind does not blow uniformly on a golf course and can be strong at any given time. This makes it difficult to determine whether the failure to hole a putt was caused by the stroke technique or by the green reading, including the effect of wind. However, this study clarified that the wind blowing on the putting green affects the ball’s stopping position, even in stable indoor conditions.
Comparing headwinds and tailwinds, the headwind was -28.0 ± 9.1 cm and the tailwind was 31.0 ± 8.8 cm at a wind speed of 2 m/s, and the headwind was -41.8 ± 9.8 cm and the tailwind was 65.5 ± 7.2 cm at a wind speed of 4 m/s. Even when given the same wind speed, the error distance from the center showed an asymmetric difference between headwinds and tailwinds, with the tailwind being more affected by the wind, resulting in a larger error distance. This result was contrary to that of a previous study that examined airborne shots, in which driver shots of approximately 260 yards and iron shots of approximately 165 yards were compared between headwinds and tailwinds at a wind speed of 10 m/s. The results showed that both driver and iron shots were significantly affected by the headwind. Both driver and iron shots showed an increase in distance of approximately 20 yards with a tailwind and a decrease of approximately 50 yards with a headwind compared to no wind (Malik et al., 2018). It is interesting to note that the magnitude of the effect of tailwinds and headwinds showed opposite trends for ball rolling on the green and airborne shots. Normally, in an airborne shot, the launched ball spins and its flight is influenced by fluid dynamics (Bearman & Harvey, 1976; Lyu et al., 2020). Although putted balls do have a short-lived launch with a low spin rate (Chou, 2004; Pope et al., 2014), rolling resistance and air resistance are the main factors that influence the path of the rolling ball. Furthermore, one should consider the effect of wind in terms of impulse, which is the product of the wind’s force and the time over which it acts. With a tailwind, the ball takes longer to stop, allowing the wind to exert a continuous force, resulting in a greater impulse. Conversely, a headwind causes the ball to decelerate faster owing to a higher relative air speed, leading to a shorter rolling time and a smaller impulse. The longer duration of the tailwind’s effect results in a larger error distance, while the headwind’s higher instantaneous force causes quicker deceleration, reducing the error distance. In summary, the tailwind’s lower force but longer duration results in a greater impulse, leading to a larger error distance.
In this study, the crosswind was tested at a distance of 3 m by artificially generating wind from right to left. At a wind speed of 2 m/s, the ball stopped approximately 17 cm to the left of the target; at a wind speed of 4 m/s, the ball stopped approximately 36 cm to the left of the target. Because the size of the hole was defined as 10.8 cm, the allowable directional error to hole a putt was approximately 5 cm to the left or right. However, the result of this experiment was significantly larger than 5 cm. The optimal grading distance to hole a putt (putt-make) was 43 cm behind the back edge of the cup, as suggested by Pelz (2000), more than 20 years ago. Trackman, a well-known Doppler radar measuring instrument, shows that when the ball speed is 0.75 m/s, the relative hole size is 75% of the entry speed to the cup, with the ball traveling 30 cm past the hole on a 2.4 m Stimpmeter green and 60 cm past the hole on a 4.2 m Stimpmeter green. The relative hole size is recommended to be approximately 30 cm past the hole for 2.4 m greens on the Stimpmeter and 60 cm past the hole for 4.2 m greens on the Stimpmeter (Trackman, 2020). Additionally, the optimal target distance past the hole is calculated through simulation and optimization techniques using a random trajectory model, considering putt length, angle, and slope (Broadie & Shin, 2014). The results of this experiment indicate that putting in a crosswind environment requires a significant estimation of the break, especially when aiming at a distance just past the hole, which makes achieving a cup-in difficult. In this experiment, it was not possible to measure the point at which the ball started to break or how much its speed dropped when it began to break. However, visual analysis of the experimental video indicates that at a wind speed of 2 m/s, the ball began to break over a distance of 2 m and deviated 5 cm to the left when it passed the 2 m mark. At approximately 2.60 m, subtracting the 43 cm indicated by Pelz, the ball passes approximately 8 cm to the left of the center and stops, on average, 17 cm left at approximately 2.95 m. Assuming actual placement, if the ball is to be hit over the distance indicated by Pelz, it is necessary to aim and launch approximately 8 cm to the right of the center. This means aiming 3 cm to the right of the right cup’s edge, given its radius is approximately 5 cm, which is approximately equivalent to one ball to the right, assuming a ball diameter is approximately 4 cm. Therefore, at a wind speed of 2 m/s, the ball is estimated to move approximately one ball to the right. Similarly, at a wind speed of 4 m/s, the ball passes approximately 15 cm left of the center at a distance of 2.6 m. Therefore, assuming that the edge of the cup is 5 cm to the right of the center, it is necessary to aim 10 cm to the right of the cup edge, which is equivalent to aiming at one cup. According to the results of approximately 4 million putts analyzed from 2003 to 2012 on the USPGA Tour, a distance of 2.40 m (8 feet) has a 50% chance of one putt, and the average number of putts is 1.50 (Broadie, 2014). From 2012 to 2024, the probability of one putt at 2.40 m on the USPGA Tour has not changed significantly and has remained at approximately 50% (USPGA, 2024). Therefore, in this experiment, we employed a putting distance of 3 m, which influences the score, and clarified the external factor of the wind’s effect on short-distance putting, which has not shown any change in the success rate of putts in approximately 20 years, and this may be useful for improving putting performance. Because even a distance as short as 3 m is affected by crosswinds, the effect of wind on the green should continue to be studied with the same attention as putting technique, line-reading methods, and cognitive research issues, such as tools and psychology.
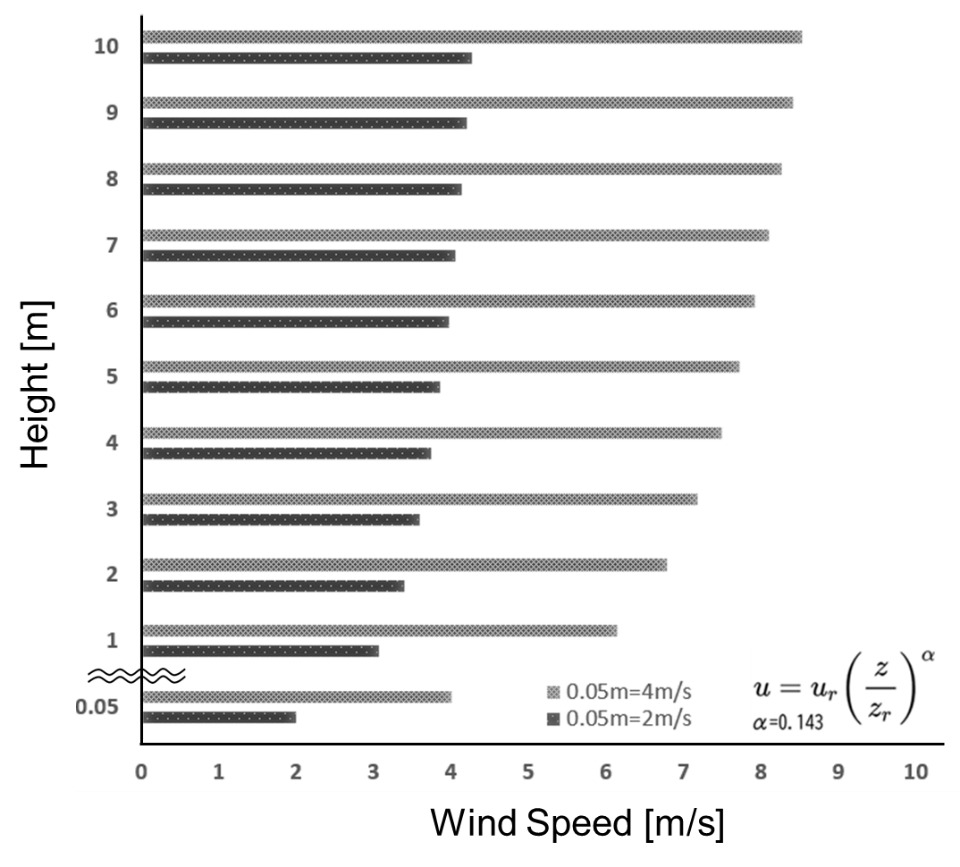
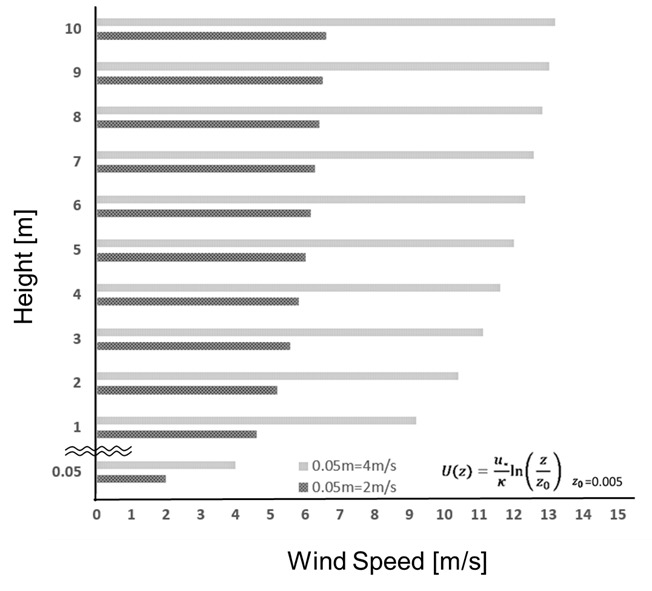
To apply the results of this experiment in practice, it is necessary to use meteorological knowledge about wind. Wind near the ground surface, such as on a putting green, differs from the representative wind speeds published in general weather reports, and wind speeds usually decrease as they approach the ground. Typical wind speeds are observed at altitudes that are unaffected by plant canopies and structures, and wind speed information at an altitude of 10 m is generally published and forecasted (Kondo, 2000). Over the past 10 years, the average wind speed in major Japanese cities (Tokyo, Osaka, Fukuoka) has been 2.7 m/s (Japan Meteorological Agency). However, the wind speeds reported in the meteorological information could not be directly applied to the results of this experiment. Therefore, we propose predicting the wind speed at an altitude of 10 m based on the wind speeds of 2 m/s and 4 m/s at a height of 5 cm observed in this experiment and forecasting the wind speed on the green based on the wind speed forecast provided by the meteorological information, which will be useful for play on that day. Two methods are used to predict wind speed profiles near the ground surface: power-law wind speed profiles and logarithmic wind speed profiles (Emeis & Turk, 2007). In predicting the wind speed using a power-law wind speed profile, when the wind speed at 5 cm above the ground is 2 m/s, the wind speed at an altitude of 10 m is estimated to be 4.3 m/s. When the wind speed at 5 cm above the ground is 4 m/s, it is estimated to be 8.5 m/s (Figure 7). Conversely, the wind speed forecast using the logarithmic wind profile estimates the wind speed at an altitude of 6.6 m/s, approximately 10 m when the wind speed at 5 cm above ground is 2 m/s, and at 13.2 m/s, approximately 10 m when the wind speed at 5 cm above ground is 4 m/s (Figure 8). Although a difference exists between the estimates of both forecasting methods, the range of wind speeds predicted to blow across the green from the representative wind speeds announced in the general weather forecast is particularly useful information for competitors and instructors involved in competitions, such as those spanning over 4 days where one stroke is at stake.


This experiment clearly showed that wind influences golf putting performance, even under stable indoor conditions. However, wind in nature is not constant and is complicated by factors such as the shape and location of the green and the height of the vegetation, which makes green placement difficult. The complexity is further compounded by the type of grass on the green, as well as the speed and slope of the surface. Therefore, it is likely that scientific research on the effect of wind on putting performance has been challenging and is often avoided. Research on putting has focused on internal factors such as hitting techniques and psychological factors; however, as far as PGA Tour statistics are concerned, no dramatic improvement in putting success rates has been confirmed in the past 20 years. Therefore, it is assumed that in the future, clarifying not only the internal factors related to putting performance but also external factors, including the effect of wind, will help improve putting performance. The confirmation that the effect of wind on putting performance has been established will lead to the possibility of further pursuing realism by incorporating wind on the green into algorithms in golf and screen golf simulations, where greater realism is required.
V. Conclusion
Under stable indoor conditions, with wind speeds of 2 m/s and 4 m/s, the ball’s stop position is affected by tailwind, headwind, and crosswind.
Even with the same wind speed, a difference in the ball’s stop position appeared asymmetrically between the tailwind and headwind, with the tailwind having a greater impact, resulting in a larger error in the ball’s stop position relative to the target.
Since near-surface winds differ from representative wind speeds, wind speed profiles can be used to roughly predict wind speeds on the green.