


INTRODUCTION
Although often perceived as a leisurely activity for the novice golfer, collegiate golf is a physically and mentally demanding sport characterized by fluctuating workloads (Turner, 2023). A standard 18-hole round lasts 4 to 6 hours, during which college golfers must carry or push clubs weighing 9-16 kg (Vendetti, 2024) while walking 8-12 km across varied terrains (Smith, 2010). Moreover, at the collegiate level, traditional tournaments begin with thirty-six holes on the first day, followed by eighteen holes the next day. Consequently, to achieve optimal levels of performance, golf athletes must generally possess adequate levels of flexibility, muscular strength and power, rotational power, and skills as well as techniques specific to the sport (Smith, 2010).
Currently, there is a large presence of findings establishing correlations between strength and conditioning measurements and golf performance measures (Doan et al., 2006; Gordon et al., 2009; Keogh et al., 2009; Loock et al., 2013; Parchmann & McBride, 2011; Read et al., 2013; Sorbie et al., 2021; Torres-Ronda et al., 2014); including several recent investigations which assessed the utility of strength and conditioning approaches to enhance physical preparation and sport-specific performance in high-level amateur to elite golf populations (Bishop et al., 2022; Brennan et al., 2024; Robinson et al., 2024). While current literature acknowledges the importance of resistance training for golfers, there remains a scarcity of research on the sport’s specific on-course cardiorespiratory demands.
Many golfers are reported to meet the American College of Sports Medicine guidelines for recommended physical activity regardless of skill level, as the sport is classified as moderate-intensity exertion for most populations (Eigendorf et al., 2020; Gabellieri, 2011; Luscombe et al., 2017; Murray et al., 2017; Sell et al., 2008). However, as reported by Doan et al. (2006), elite golfers perceive a round of golf to be both mentally and physically demanding, with a significant post-round increase in cortisol levels indicating the physiological toll the game takes on them. More so, Smith et al. (2012) show that even small fluctuations in physiological state can affect golf performance. As even trivial differences can significantly impact a golfer’s performance ranging from gaining or losing a few yards on a swing to changes in heart rate, breathing, and focus improving cardiorespiratory fitness could benefit a golfer’s game.
Draovitch and Simpson (2007) describe the importance of cardiorespiratory fitness for golf performance. They suggest that increased aerobic training may reduce physical limitations and help golfers optimize swing patterns, improve ball striking capability, increase club head speed, and produce more powerful and coordinated swinging actions resulting in longer drives that are better placed. More so, Smith (2010) suggests that maintaining a relatively stable physiological state and minimizing fatigue may be important for golf. Currently, there are limited evidence which provide measurement of cardiorespiratory fitness demands during on-course golf using valid instrumentation and direct methods (Dobrosielski et al., 2002; Eigendorf et al., 2020; Sell et al., 2008; Smith, 2010). A review from 2010 reported that golfers maintain oxygen uptake levels between 35 and 46% of peak during an 18-hole round (Smith, 2010). Sell et al. (2008) conducted a case study on a 43-year-old male who report higher heart rates (67.4% of peak), oxygen uptake (22.4 mL/kg/min), and ventilation (50.8 L/min) while waleighteenng and carrying a bag over 18 holes compared to using a caddy or a cart. Dobrosielski et al. (2002) matched adult male golfers with heart disease to healthy adults of a similar age. They report that healthy males fail to reach 60% of their maximal metabolic equivalent while walking nine holes and pulling a cart. Another work by Eigendorf et al. (2020) provides the only oxygen consumption data on younger golfers, including some with low handicaps. They observed that amateur low handicap golfers achieve ~45% of their peak oxygen uptake while maintaining roughly 64% of their peak heart rate during 9 holes of play. Although this work examined low handicapped amateurs, the handicaps reported were still higher than those typical of NCAA Division I collegiate golfers. Thus, although some work has been conducted to aid in determining the cardiorespiratory demands of golf, none have focused specifically on collegiate NCAA Division I male golfers. Due to limited direct evidence, O’Donnell et al. (2024) recently emphasized the need for future studies to employ more valid methodologies, highlighting the need for further research to address the remaining gaps in knowledge, specifically regarding direct assessment of the cardiorespiratory demands of collegiate NCAA Division I golfers.
To effectively prepare collegiate golfers for elite competition, it is crucial to understand the cardiorespiratory demands they face during play. At present, the literature does not provide adequate data to reflect the cardiorespiratory demands of NCAA Division I collegiate golfers. Knowledge of key cardiorespiratory factors, such as percent of peak oxygen uptake (V̇O2), ventilation, and heart rate, provides valuable insights into the specific demands of the sport at this level. By examining these demands, coaches, practitioners, and athletes can tailor training regimens to optimize performance. Therefore, the purpose of this study was to assess the time NCAA Division I collegiate male golfers spent within each of the four quartiles (0-25%, 26-50%, 51-75%, 76-100%) of peak V̇O2, heart rate, and ventilation over five holes of golf. We hypothesized that, over the first five holes of a round, golfers would spend a majority of their time above 50% of their peak cardiorespiratory response during course play.
METHODS
Participants
A cohort of 6 collegiate men’s golf athletes (age: 21 ± 2 years, mass: 81 ± 12 kg, height: 178 ± 10 cm) on an NCAA Division I team were recruited to participate in this study. Participants had a minimum of ten years of golf experience, and all golfers’ bags weighed ~11.5 kg. Each participant was cleared medically by their athletic trainer for sport participation. All healthy athletes who were not experiencing sport limitations participated in the study. All athletes were informed of the risks associated with the study and provided written informed consent prior to participation. All protocols and procedures associated with this study were approved by the Oklahoma State University IRB.
Experimental Approach
In a repeated measures design, athletes completed a peak V̇O2 test. One week later, on a separate testing day, athletes were monitored whilst completing the first five holes of a round of golf. Data were recorded continuously via breath-by-breath exchange and heart rate (HR) monitor technology. Athletes were directed to play the five holes as per their normal regimen, to the best of their ability. All participants walked the five holes while carrying a full set of clubs, which is typical of male NCAA golfers.
Visit 1
During the initial visit, participants performed a maximal graded exercise test conducted on a Trackmaster TMX 425C (Full Vision, Inc., Newton, KS) motorized treadmill following the modified Bruce protocol (Bruce et al., 1963). HR was collected continuously during the test using Polar H10 HR sensors (Polar Electro Inc., Bethpage, NY) placed tightly around the chest at the level of the xiphoid process. HR was recorded at the end of every stage (every 3 minutes) and at task failure during the completion of the test. V̇O2peak values were measured via a breath-by-breath automated pulmonary-metabolic gas exchange system (COSMED, Rome, Italy). All data were then uploaded to an Excel database for statistical analysis. Before all testing, the oxygen analyzer and the flow sensor were calibrated to the manufacturer’s guidelines.
Upon arrival for Visit 1, golfers completed a standardized warmup consisting of 5 minutes of light cycling followed by 5–10 minutes of dynamic stretching. The graded exercise test then commenced following the modified Bruce protocol. Participants began with a 2-minute walking warm-up at 1.7 mph and 0% incline. The test then progressed to 1.7 mph at a 10% incline. For the first five stages, both speed and incline increased every 3 minutes, speed by 0.8 mph and incline by 2%. For all subsequent stages, speed increased by 0.5 mph and incline by 2% every 3 minutes. If at any point the participant experienced pain or wished to cease exercise for any other reason, they were instructed to grab the bars of the treadmill and straddle the belt, this would direct the investigators to cease the exercise test immediately. Otherwise, golfers were instructed to go until complete exhaustion, where “they cannot go any longer.” Maximal effort was confirmed if golfers met at least three of four criteria: plateau in oxygen consumption, respiratory exchange ratio ≥ 1.10, HR within 10 bpm of age-predicted max, and volitional exhaustion. Once the test was completed, and maximal effort was confirmed, the golfer was immediately taken down to the warm-up stage of the protocol and placed into a cool down until HR was within 10 bpm of their initial testing HR.
Visit 2
One week following visit 1, cardiorespiratory parameters including HR and ventilatory response were monitored continuously during five holes of course play. Upon arrival, athletes completed a 30-minute warm-up. They were then fitted with a portable metabolic device (V̇O2 Master Health Sensors Inc., Vernon, BC, Canada) that has been previously validated (Davis, 2024). The metabolic gas analyzer was used to measure relative V̇O2 (rV̇O2, mL/kg/min), absolute V̇O2 (aV̇O2, mL/min), ventilation (V̇E, L/min), and thus tidal volume (VT, L) and breathing frequency (Fb, breaths per minute). HR was recorded via the same Polar H10 HR sensor (Polar Electro Inc., Bethpage, NY) as used during visit 1. The monitor was placed tightly around the chest in the same position as during visit 1. After being fitted with biometric sensors, athletes were instructed to complete the initial 5 holes of an elite collegiate-level course (Karsten Creek, Stillwater, OK) at a self-paced rate (duration of course play: 57.1 ± 17.9 minutes). The 5 holes consisted of one par 3, three par 4’s, and one par 5, and the environmental conditions were as follows: temperature 22.4 ± 5.1°C, relative humidity 40.5 ± 2.3%, and barometric pressure 737.2 ± 1.4 mmHg.
Measurements
To assess V̇E, minute ventilation was measured, representing the total volume of air moved in and out of the lungs each minute. To calculate V̇E, VT, the volume of air per breath was multiplied by the frequency of breaths per minute (Fb). This was measured using one of two flow sensors: one used during the maximal laboratory test and the other used during on-course data collection. Both sensors tracked the rate of exhaled air combined with data on the concentration of oxygen and carbon dioxide in the exhaled breath using the same methodology. The concentrations of oxygen and carbon dioxide were then analyzed in the expired air using the respective gas analyzer. The difference in oxygen content between inspired and expired air was calculated to determine the total amount of oxygen consumed per minute, aV̇O2. Relative V̇O2 was then determined by multiplying aV̇O2 by body weight in kg. All data was then uploaded to an Excel database for statistical analysis.
Heart rate was determined via Polar H10 as previously used in visit 1 and 2. During course play, the sensor continuously measured electrical activity of the heart, providing researchers with real-time HR data that was transmitted wirelessly via Bluetooth to a paired device. Regarding the maximal graded exercise test, electrical activity of the heart was continuously measured, and HR was recorded at the end of every stage (every 3 minutes) and at task failure during the completion of the test.
Data Analysis
A 5-point rolling average was calculated for each variable (rV̇O2, aV̇O2, V̇E, Fb, and VT) determined during the peak exercise test, with the exception of HR, for which the maximal value recorded at the termination of the test was used. The peak rV̇O2 was determined as the highest 5-breath average during the test and was contingent upon the coefficient of variation (CV) of the five breaths being less than 30%. In instances where the CV exceeded this threshold, outliers within the 5-point window were identified and replaced with the average of the two adjacent superior and inferior data points. The recalculated peak rolling average was utilized only if the CV remained below 30%. All other variables were determined at the time corresponding to rV̇O2peak, with a 5-breath rolling average recorded for each corresponding point.
Additionally, a rolling average for each variable (rV̇O2, aV̇O2, V̇E, Fb, VT, and HR) from the V̇O2 master on-course dataset was calculated using the same 5-point window methodology. Each rolling average was subsequently expressed as a percentage of the peak response during the max test. Finally, the data were organized into quartiles (Q1, Q2, Q3, Q4) where Q1 represents 0 to 25 percent of the peak response, Q2 represents 26 to 50 percent of the peak response, Q3 represents 51 to 75 percent of the peak response, and Q4 represents 76 to 100 percent of the peak response. This was done to determine the percentage of variables expended within each quartile across the five holes for each athlete.
RESULTS
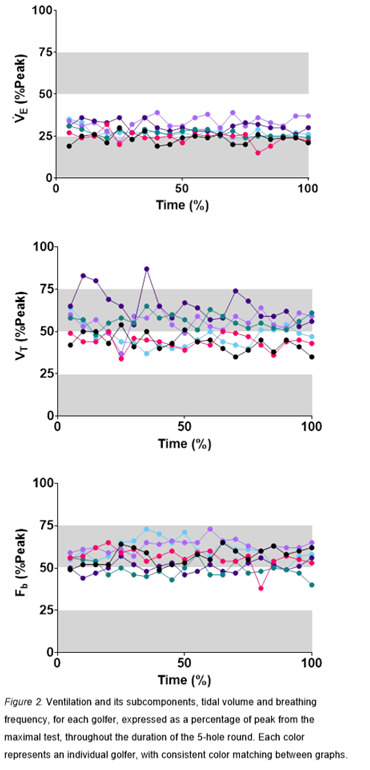
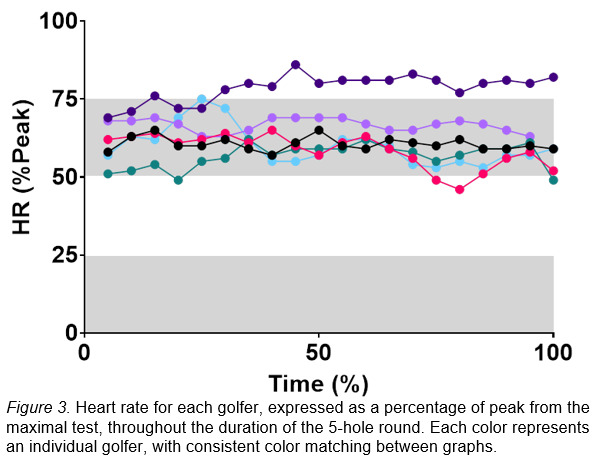
While performing the 5-hole round of golf, on average, rV̇O2 was 33 ± 10% of peak. Additionally, rV̇O2 fell within Q1 and Q2 18% and 76% of the time, respectively. On average, aV̇O2 was 31 ± 9% of peak. It remained within Q1 and Q2 21% and 74% of the time, respectively. On average, V̇E was 27 ± 7% of peak with participants in Q1 and Q2 37% and 64% of the time, respectively. On average, Fb was 57 ± 11% of peak with participants in Q2 and Q3 30% and 64% of the time, respectively. On average, VT was 31 ± 9% of peak and was spread evenly, where participants were within Q2 and Q3 49% and 45% of the time, respectively. On average, HR was 62 ± 9% of peak with participants in Q3 82% of the time. Interestingly, the majority of the remaining time was spent in Q4 of peak HR, with 14% of the time spent.

DISCUSSION
The major finding of this study was that during a 5-hole round of golf, collegiate male golfers’ cardiorespiratory response was predominantly between 26% and 75% of their peak aerobic response to exercise. These findings do not support our original hypothesis that golfers would spend a majority of their time above 50% of their peak cardiorespiratory response during course play. These results indicate that the overall cardiorespiratory response may not consistently surpass 50% of peak aerobic capacity. However, specific physiological measures, such as HR and Fb, could serve as useful indicators to monitor golf performance and the metabolic demands of course play.
The Oxygen Uptake Response to Course Play
During the five-hole round, athletes primarily worked within Q2 of their peak oxygen uptake, with the majority of the remaining time spent in Q1. Previous research has also examined the relative intensity of golf using oxygen consumption. Smith (2010) conducted a review and reported that golfers maintain V̇O2 levels between 35 and 46% of V̇O2peak during an 18-hole round. Eigendorf et al. (2020) similarly observed that young to middle-aged amateur golfers, regardless of low or high handicap, maintained V̇O2 levels at approximately 45 to 46% of maximal effort during nine holes. Similarly, Dobrosielski et al. (2002) reported that healthy middle-aged to older men worked at ~46% of peak oxygen uptake during a 9-hole round. Slightly more central to the present article’s range, Murase et al. (1989) reported that healthy middle-aged men worked on average at 38% of V̇O2peak during a round of eighteen holes. Although both Eigendorf et al. (2020) and Dobrosielski et al. (2002) use direct measurement, Murase et al. (1989) estimated oxygen uptake from HR responses during a treadmill-walking test, thus making it more difficult to compare to the present findings, which were assessed directly.
Thus, previous research has shown ranges from 38 to 46% of V̇O2peak during on-course play is utilized during golf for middle-aged to older adults. These findings confirm that the V̇O2 demands observed in our sample are similar to those reported in golfers across different age groups and competitive levels. However, the present article is the first, to our knowledge, to directly report these on-course metrics in NCAA Division I collegiate male golfers.
The Ventilatory Response to Course Play
To our knowledge, no prior studies have investigated ventilation as a percentage of peak effort in golfers. Thus, we report novel findings with the following results. Athletes spent 62% of their time in Q2 of their peak V̇E capacity. Notably, the two components of V̇E — Fb and VT —demonstrated distinct patterns. Breathing frequency met our hypothesis and was expectedly elevated, with 64% of time spent in Q3. In contrast, VT distribution was more evenly divided, with 49% of time spent in Q2 and 45% in Q3. Although Fb dominated higher percentages of peak, this distribution did not alter V̇E, which remained predominantly in Q2 with 62% of time spent in this quadrant. This suggests that breathing patterns may be an important physiological variable to monitor in golfers, beyond oxygen uptake alone.
To our knowledge, only four other articles have reported aspects of V̇E play in golfers. Sell et al. (2008) report that the average V̇E over eighteen holes was 50.8 L/min whilst walking and carrying a full set of clubs. While the current article did not report raw data, peak average V̇E over five holes was between 47 and 81 L/min for all participants. Previous findings indicate elite golfers do not differ in mean Fb but had shallow breathing during the swing motion (Kawashima et al., 1994; Neumann & Thomas, 2009) and a greater tendency to exhale before the swing (Neumann & Thomas, 2011). However, both these findings were conducted solely prior to and during putting and did not cover live course play. Thus, with differing demographics and methodologies, it is difficult to compare the results of these reports to the present findings.
The Heart Rate Response to Course Play
HR predominated Q3 with 82% of time spent in this quadrant. Golfers work between 52 and 67% of their maximal HR during an 18-hole round (Smith, 2010). Supporting these findings, previous research across a range of golfers has reported similar HR responses during golf. Gabellieri (2011) reports recreational male golfers averaging 55% of maximal HR over eighteen holes. Similarly, Eigendorf et al. (2020) reported that low and high handicap golfers average ~64% and ~62% of peak HR, respectively, during a 9-hole round. Among professionals, Scalise et al. (2024) reported average HR of 56% of maximal during tournament play consisting of four 18-hole rounds. Meanwhile, Broman et al. (2013) found that HR was above 50% of peak 82% of the time during an 18-hole round in young golfers (~27 years old). Similar to the present findings’ methodology, Sell et al. (2008) reported an average HR of 67% of peak during eighteen holes with 53% of time spent between 40 and 50% peak HR, 34% of time spent between 50 and 60%, and 4% of time spent above 60%. This report, however, was a middle-aged single-subject case study, thus making it difficult to compare to the present article’s findings conducted on an NCAA Division I team of collegiate-aged golfers.
Across these studies HR fell predominantly within Q3. However, the present study also reports upwards of 13% of time spent in Q4. Although the present findings cannot directly determine whether the quartiles are due to physical demands or mental stressors, prior research offers valuable context suggesting that physical demands are more likely the cause. Neumann & Thomas (2009, 2011) examined the cardiorespiratory response of elite, experienced, and novice golfers on two separate occasions during self-paced putts and found that elite golfers consistently had lower HRs than novice golfers, independent of putting task. Additionally, McKay et al. (1997) monitored elite golfers prior to, during, and after a tournament and practice round and revealed a clear distinction between competition and practice, with HR decreasing notably during practice sessions. Given that the present findings were conducted in NCAA Division I athletes under a “no pressure” practice setting, it is reasonable to conclude that physical demands, rather than mental stressors, are more likely responsible for the observed quartiles in the present study. Furthermore, the differences observed in our data from previous studies suggest that NCAA Division I male golfers may exhibit distinct physiological characteristics, representing a novel contribution to the literature.
Limitations
The current study was not without limitations. First, only the initial five holes of an 18-hole round were analyzed. This decision was based on the significant demands placed on athletes, who were required to wear both a heart rate monitor and a face mask gas analyzer. After the first five holes, it was determined by the research staff and coaches that the participants’ focus might be compromised due to changes in perception and the perceived workload associated with wearing a fitted mask. Additionally, different metabolic devices were used for the maximal test and on-course data collection, which may limit direct comparisons between laboratory and field data. Moreover, researchers did not control nutrition or hydration measures before Visit 1 or 2. Poor dietary behaviors in conjunction with reduced hydration levels could have impacted cardiorespiratory measures. Finally, as this study was conducted on a single men’s collegiate team, the findings are based on a limited sample. Future research should incorporate larger, more diverse samples and adopt methodologies that allow for meaningful analysis of individual responses.
Future Application
Despite having cardiorespiratory fitness levels categorized within the good to superior range according to ACSM guidelines, these athletes still engaged near or above 75% of their peak capacity for both Fb and HR during the five holes assessed. Thus, we suggest that NCAA Division I golfers should attempt to maintain physical conditioning to meet the demands of their sport. Additionally, given that athletes spent 62% of their time in Q2 of their peak V̇E capacity and demonstrated distinct trends in Fb and VT, monitoring and optimizing breathing patterns throughout course play may be an important physiological variable for improving performance in golfers, however, further research is needed. More so, it is theorized that higher fitness levels may reduce recovery time between rounds, thereby allowing collegiate golfers to perform more frequent rounds of golf, such as seen in tournament play. Thus, future research should determine whether improving cardiorespiratory fitness will translate to meaningful changes in golf performance and recovery.
More so, future investigations should aim to evaluate these cardiorespiratory parameters over the course of an entire 18-hole round to determine if responses are similar or exaggerated within this population and if differences are seen in NCAA Division I female golfers. Additionally, research should determine means to quantify whether changes in Fb and HR occur solely due to physical strain, or if mental stressors are affecting these results, and if breathing pattern plays a role.
Conclusion
To our knowledge, no other study has reported the cardiorespiratory response to any number of holes in NCAA Division I male golfers. Thus, findings from the current study provide novel insight into these high-level collegiate athletes, whereby the overall cardiorespiratory response may not consistently surpass 50% of peak aerobic capacity. However, specific physiological measures, such as HR and Fb, could serve as useful indicators for monitoring golf performance and the metabolic demands of course play.