


Introduction
Golf participation is growing; and golfers are increasingly turning to technology to track their performance. A reported 45 million people in the USA aged ≥6 years played golf in some form in 2023 (National Golf Federation, 2023) and there are 8.2 million registered golfers (member of a club or affiliated with a national golf federation) worldwide (outside of the USA and Mexico) (The R&A, 2024). In 2024, there were 42.7 million unregistered golfers playing 9- and 18-hole rounds of golf, an increase of 24% since 2020 (The R&A, 2024). Additionally, £5.2 billion was spent by UK golfers within the golf industry in 2019, £152.4 million of which was spent on golf technology such as training aids and game-improvement devices (Sports Industry Research Centre, 2023).
In research settings, golf performance has typically been measured in a laboratory setting or on the driving range. For example, Leach et al. (2017) investigated the validity and reliability of commercially available radar (Trackman) and stereoscopic optical launch monitors (Foresight GC2), finding them to be accurate measures of golf impact factors and ball flight characteristics for commercial (coaching and club fitting) and golfers’ usage. Launch monitors have been used frequently in experimental studies set indoors or on a driving range to collect golf performance metrics, such as club head speed, ball speed, and carry distance (e.g., Brennan et al., 2024; Corke et al., 2022; Fisher, 2019; Ichikawa et al., 2022; Wells et al., 2024). However, launch monitor technology is costly (Trackman ≈ £20,000), limiting its accessibility to researchers and coaches. Furthermore, performance data collected indoors or on the driving range may lack ecological validity, as it cannot replicate on-course conditions – Langdown et al. (2019) call for the continued use of ball tracking technologies such as launch monitors within environments that are most representative of on-course golf performance. Likewise, much of the research investigating putting performance has taken place within a laboratory using artificial grass or carpeted surfaces and simple, straight-line putting tasks (Binsch et al., 2009; Chen et al., 2021; Hurrion, 2009; Kearney, 2015; Richardson et al., 2018). Considering these limitations, there is a need for a low-cost alternative to measuring golf performance data that can take place on the golf course.
At the professional level, on-course golf performance is measured by The ShotLink system which has recorded every shot hit on the PGA TOUR since it was developed in 2001 for performance-tracking and analysis purposes (PGA TOUR, 2025). The ShotLink system deploys 90 walking volunteers with laser rangefinders and digital maps, 54 high-definition video cameras providing 360° coverage of every green and two mobile data centres to collect raw shot position and distance data (PGA TOUR, 2025). These data have been used to calculate performance metrics such as strokes gained (a quantitative measure of the quality of a golf shot [Broadie, 2012]) and to improve the televised experience for spectators (PGA TOUR, 2025). The ShotLink system relies on a large number of resources and so, consumer brands such as Arccos and Shot Scope have sought to provide amateur golfers with similar performance-tracking capabilities and strokes gained metrics by developing affordable 1-Hz global positioning system (GPS) devices. These devices present golfers, coaches and researchers with a new opportunity to collect on-course golf performance data.
GPS is commonly utilised in field-based team sports, where devices are used to measure total distance covered, speed and changes in direction. Research linked to team-sports have found 1-Hz GPS devices to be a valid and reliable method of measuring human distance travelled in various settings including; Australian football (Jennings et al., 2010), cricket (Petersen et al., 2009), soccer (Portas et al., 2010) a generic field-based team sport activity (Gray et al., 2010), a high-intensity exercise circuit (Coutts & Duffield, 2010), a team-sport simulated running circuit (Willmott et al., 2019), ultra-marathon running (Johansson et al., 2020), and wheelchair tennis (Sindall et al., 2013). In a golf context, GPS devices have been used to measure total walking distance for the purposes of understanding energy expenditure (e.g., Zunzer et al., 2013). Most GPS applications are concerned with measuring total human distance traveled in a continuous way whereas the measurement required of the GPS device for tracking golf performance relies on a series of individual shot distance measurements. However, research within golf is currently limited. James et al. (2007) compared the respective ability of a laser rangefinder, a GPS device and a walking measurement to judge golf shot distance when approaching the green, finding the laser to be the most accurate measure, followed by the GPS device with reasonable agreement to the laser within 4m. To date, however, there is no research investigating the validity and reliability of GPS devices for measuring on-course golf performance (e.g., Arccos or Shot Scope CONNEX). The aim of this investigation was to assess the validity and reliability of commercially available 1-Hz GPS golf performance-tracking devices for on-course use.
Methods
Study design
This study was approved by the Sports and Exercise Science SREP ethics committee at Anglia Ruskin University (East Road, Cambridge, England, CB1 1PT) (ETH2324-9824). Data collection took place at The Gog Magog Golf Club (Shelford Bottom, Cambridgeshire, England, CB22 3AB) and Girton Golf Club (Dodford Lane, Girton, Cambridgeshire, CB3 0QE) between July and December 2024. In the context of the present study, concurrent validity assessed the agreement between the observed value and the true value of the measure, whilst retest reliability concerned the reproducibility of the observed value when repeating the measure (Hopkins, 2000). There were two conditions for this study: 1) an 18-hole concurrent validity condition (device vs. control) and 2) a 9-hole retest reliability condition (system 1: device 1 vs. device 2; system 2: device 1 vs. device 2). In both conditions, participants were asked to play to the best of their ability and to follow the stroke play format of golf wherein each shot is counted, all putts were holed out and the total number of shots taken was summed for the final score.
Participants
Participants were recruited from either the membership at The Gog Magog Golf Club via the club’s weekly newsletter, or by word of mouth. A total of 10 participants (2 females and 8 males) took part in this study. They ranged in age from 20-75 years, with a mean ± standard deviation (SD) age of 48 ± 23 years. Participants had a range of golf handicaps from 0.7-20.0 with a mean golf handicap of 10.7 ± 6.9 shots. All participants completed the required 18-hole and 9-hole conditions.
Equipment
Two systems were used for data collection: the Arccos Smart Sensors (GEN3+; retail price ~£180) with Arccos Link Pro (~£200), and the Shot Scope CONNEX (~£100). The Arccos Smart Sensors screwed into the grip end of the golf club (Fig. 1a) and collected motion and aural data as the participants took their shots, automatically registering when a shot had been played and by which club. These data were communicated to the Arccos Link Pro, where it combined with GPS (1-Hz) location data of where the shot was hit. To minimise the need for the participant to interact with their smartphone during the round, machine learning algorithms (a brand of artificial intelligence that predict or classify data [IBM, 2021]) are utilised to improve the accuracy of this process, however the details of the precise way these algorithms function was proprietary information that was not available from Arccos. The Shot Scope CONNEX could also be screwed into the grip end of the golf club (Fig. 1a) and utilised Radio Frequency Identification (RFID) technology. The sensor attached to each club was tapped against a Near Field Communication (NFC) enabled smartphone to register a shot had been played. Both the Arccos and Shot Scope systems linked to a smartphone application (Fig. 1b) which plotted the location of every shot hit, the distance hit/remaining of each shot, the golfers’ score and performance analytics such as average club distances and strokes gained.
A Bushnell Golf Tour V5 Shift laser rangefinder was used for the control measure (from herein referred to as the ‘laser’). This handheld monocular device magnified six times, presenting the distance of the target in yards or metres on the internal liquid crystal display (LCD). The laser had a range of 5-1,300 yards, so measurements of <5 yards were recorded with a tape measure (50m open reel tape measure) to the nearest foot. James et al. (2007) found measuring golf shot distance with a laser rangefinder to be the most repeatable measure of golf shot distance in comparison to GPS and walking measures, with a coefficient of repeatability of 2.6m. Laser rangefinders have also been validated and employed to measure actual golf shot distance for the purpose of comparison to elite player predictions of distance (Robertson & Burnett, 2013), and to measure golf ball carry distance to an accuracy of 0.1m (Kenny et al., 2008).
Procedure
In the concurrent validity condition, it was not possible to have both Arccos Smart Sensors and Shot Scope CONNEX installed in the participants’ clubs simultaneously. The Arccos Smart Sensors necessitated installation onto the golf club to collect the data required for shot detection, whereas the Shot Scope CONNEX could perform the same function handheld.
On arrival at either The Gog Magog Golf Club or Girton Golf Club, the researcher installed the Arccos Smart Sensors onto the grips of the participants’ clubs, and placed the Shot Scope CONNEX in a box, arranged according to the participants’ set of clubs. The researcher then configured both smartphone applications. During set-up, participants were permitted 30-minutes to perform a self-selected warm-up. Participants then began their round, followed by two researchers; one controlling the Arccos and Shot Scope smartphone applications and one with the control measure. At every shot, the participant approached their ball as usual and played their shot which activated the Arccos Smart Sensor attached to that club, detecting the shot automatically. The first researcher (R1) stood directly above the point where the shot had been played from and tapped the corresponding Shot Scope CONNEX against the smartphone, thus recording the shot. The participant and R1 then walked on to the next shot, whilst the second researcher (R2) remained at the location of the previous shot. R2 brought the laser up to eye-level, looked through the monocular lens, targeted the torso of R1 and pressed the button to fire the laser and produce the yardage between themselves and R1. Hence, all laser measurements were taken from a standing position, at head height. The process continued until the participant reached the green where the Shot Scope smartphone application continued to measure the distance hit (distance between the current position of the ball and the previous location of the ball), whereas the Arccos smartphone application changed to measure the distance remaining (distance from the current position of the ball to the hole). R1 and R2 thus collected both measurements for each shot using a combination of laser and tape measurements until the last shot hit and the ball was holed. Finally, R1 set the location of the hole on the green using the functionality of each respective smartphone application and the trio would move on to the next hole.
The retest reliability condition posed methodological challenges as the Arccos Smart Sensors warranted physical attachment to the golf club. To solve this, the researchers installed the Arccos Smart Sensors into the participants’ set of clubs and a second set of Arccos Smart Sensors into a second set of golf clubs provided by the research team. They then configured the applications identically. The Shot Scope CONNEX were configured as before and identically to each other. The participant was permitted a 30-minute self-selected warm up before teeing off, whence they were followed by two researchers, R1 and R2, each managing one Arccos device and one Shot Scope device. At each shot, the participant hit the ball with their set of clubs. Immediately, they hit another ball from the same location using the corresponding club in the second set. R1 and R2 then recorded the shot on their Shot Scope device. The trio walked on together to the position of the first ball hit, picking up the second ball on the way and repeating the steps above. On the green, R1 and R2 would set the position of the hole using the inbuilt functionality in each of the smartphone applications.
From herein, the combined Arccos Smart Sensor, Arccos Pro Link and Arccos smartphone application system will be referred to simply as ‘Arccos’ and the Shot Scope CONNEX and Shot Scope smartphone application system as ‘Shot Scope’. Due to the difference in the way the two systems measure putt length, the control data for the validity condition is split into Control A (control measure including putts measured by distance remaining) and Control B (control measure including putts measured by distance hit). In the reliability condition, the two Arccos systems are referred to as ‘Arccos 1’ and ‘Arccos 2’, and the two Shot Scope systems are referred to as ‘Shot Scope 1’ and ‘Shot Scope 2’.
Statistical analyses
Data were assessed for normality and sphericity prior to statistical analyses, and both Kolmogorov-Smirnov and Shapiro-Wilk tests of normality returned statistically significant results, indicating non-normal distribution. Additionally, a visual inspection of histogram and quantile-quantile (Q-Q) plots was conducted and confirmed that normality of distribution could not be assumed in these data. Therefore, non-parametric validity data were analysed using Wilcoxon signed-rank tests, Spearman’s rank-order correlation coefficients, and coefficients of determination (R2). Baumgarter (1989) has defined two distinct types of reliability: absolute and relative. Relative reliability is the degree to which individuals maintain their position in a sample over repeated measures and absolute reliability assesses the degree to which repeated measures vary for individuals. To determine the level of measurement error acceptable for practical use of a measurement tool, it is recommended that a battery of both relative and absolute measures of reliability is used (Atkinson & Nevill, 1998). Both relative (Spearman’s rank-order correlation coefficients, intraclass correlation coefficients [ICC], and coefficients of determination [R2]), and absolute measures (typical error of measurement [TEM], coefficient of variation [CV], and 95% limits of agreement [LOA]) of reliability were utilised in this study (Willmott et al., 2019). Spearman’s rank-order correlation coefficients and ICC were categorised as: ‘weak’ (r <0.3), ‘moderate’ (r = 0.3-0.5) and ‘strong’ (r >0.5) based on the thresholds established by Cohen (1988). Mean bias was calculated as the mean of the individual differences between measures and 95% LOA were determined from Bland-Altman plots (Bland & Altman, 1986). TEM was calculated from the SD of the mean difference between measures, divided by the √2 (Hopkins, 2000), and is expressed in absolute (TEM) and relative terms (CV). CV results were categorised as: ‘poor’ (>10%), ‘moderate’ (5-10%), and, ‘good’ (<5%) (Scott et al., 2016). Statistical significance was set at p <0.05 and analyses were conducted using IBM SPSS Statistics v29 and the reliability spreadsheet developed by Hopkins (2015). Data are presented as mean ± SD shot distance.
The shots recorded were divided into categories by distance and statistical analyses were applied to each distance category. There were 7 categories: ≥200 yards, 150-199 yards, 100-149 yards, 50-99 yards, ≤49 yards, and Putts (shots hit with a putter from the green) measured in feet.
Results
Shots were split into categories by distance (yards/feet). Table 1 displays validity data, the results of the Wilcoxon signed-rank tests, Spearman’s rank-order correlation coefficients, and coefficient of determination. Table 2 displays reliability data, the results of Spearman’s rank-order correlation coefficients, coefficient of determination, ICC, TEM and CV.
Validity
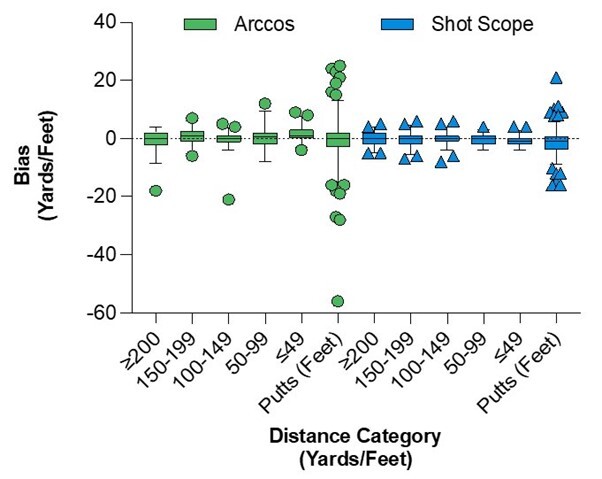
Spearman’s rank-order correlation coefficients were ≥0.91 across all comparisons for both Arccos vs. Control A and Shot Scope vs. Control B, and all were statistically significant (p <0.05). The coefficients of determination (R2) demonstrated that between 88-96% of all variation in shot distance in Control A could be explained by Arccos, and between 90-98% of all variation in Control B could be explained by Shot Scope. Wilcoxon signed-rank tests revealed significant differences in the 150-199 yards distance category between the Shot Scope and Control B (mean bias ± SD = 1 ± 4 yards, z = -3.05, p <0.05), in the 50-99 yards distance category between the Arccos and Control A (mean bias ± SD = 1 ± 3 yards, z = -2.79, p <0.05) and Shot Scope and Control B (mean bias ± SD = 1 ± 2 yards, z = -4.06, p <0.05), and in the ≤49 yards distance category between Shot Scope and Control B (mean bias ± SD = 1 ± 3 yards, z = -3.21, p <0.05) (see Table 1). The mean bias ± SD across all Arccos comparisons ranged from -1 ± 9 yards to 1 ± 3 yards, and across all Shot Scope comparisons from -1 ± 5 yards to 1 ± 4 yards (see Figure 2).

Reliability
All distance categories in the Arccos 1 vs. 2 comparisons returned statistically significant Spearman’s rank-order correlation coefficients (rs = ≥0.84, p <0.05) and ICC’s ≥0.85 (see Table 2). Coefficients of determination showed that between 72-98% of the variation in Arccos 1 could be explained by Arccos 2. The TEM for the Arccos 1 vs. 2 comparisons were 2 yards (155-199 yards and ≤49 yards) or 3 yards (≥200 yards, 100-149 yards, 50-99 yards), and the TEM for the Putts category was 6 feet. CV ranged from 1.3% (≥200 yards) to 69.0% (Putts).
All distance categories in the Shot Scope 1 vs. 2 comparisons returned statistically significant Spearman’s rank-order correlations coefficients (rs = ≥0.86, p = <0.05) and positive ICC’s (≥0.96). Coefficients of determination showed that between 92-99% of the variation in shot distance in Shot Scope 1 could be explained by Shot Scope 2. The TEM for the Shot Scope 1 vs. 2 comparisons were 1 yard (50-99 yards and ≤49 yards) or 2 yards (≥200 yards, 150-199 yards, and 100-149 yards), whereas the TEM for the Putts category was 3 feet. CV ranged from 0.7% (≥200 yards) to 62.0% (Putts).
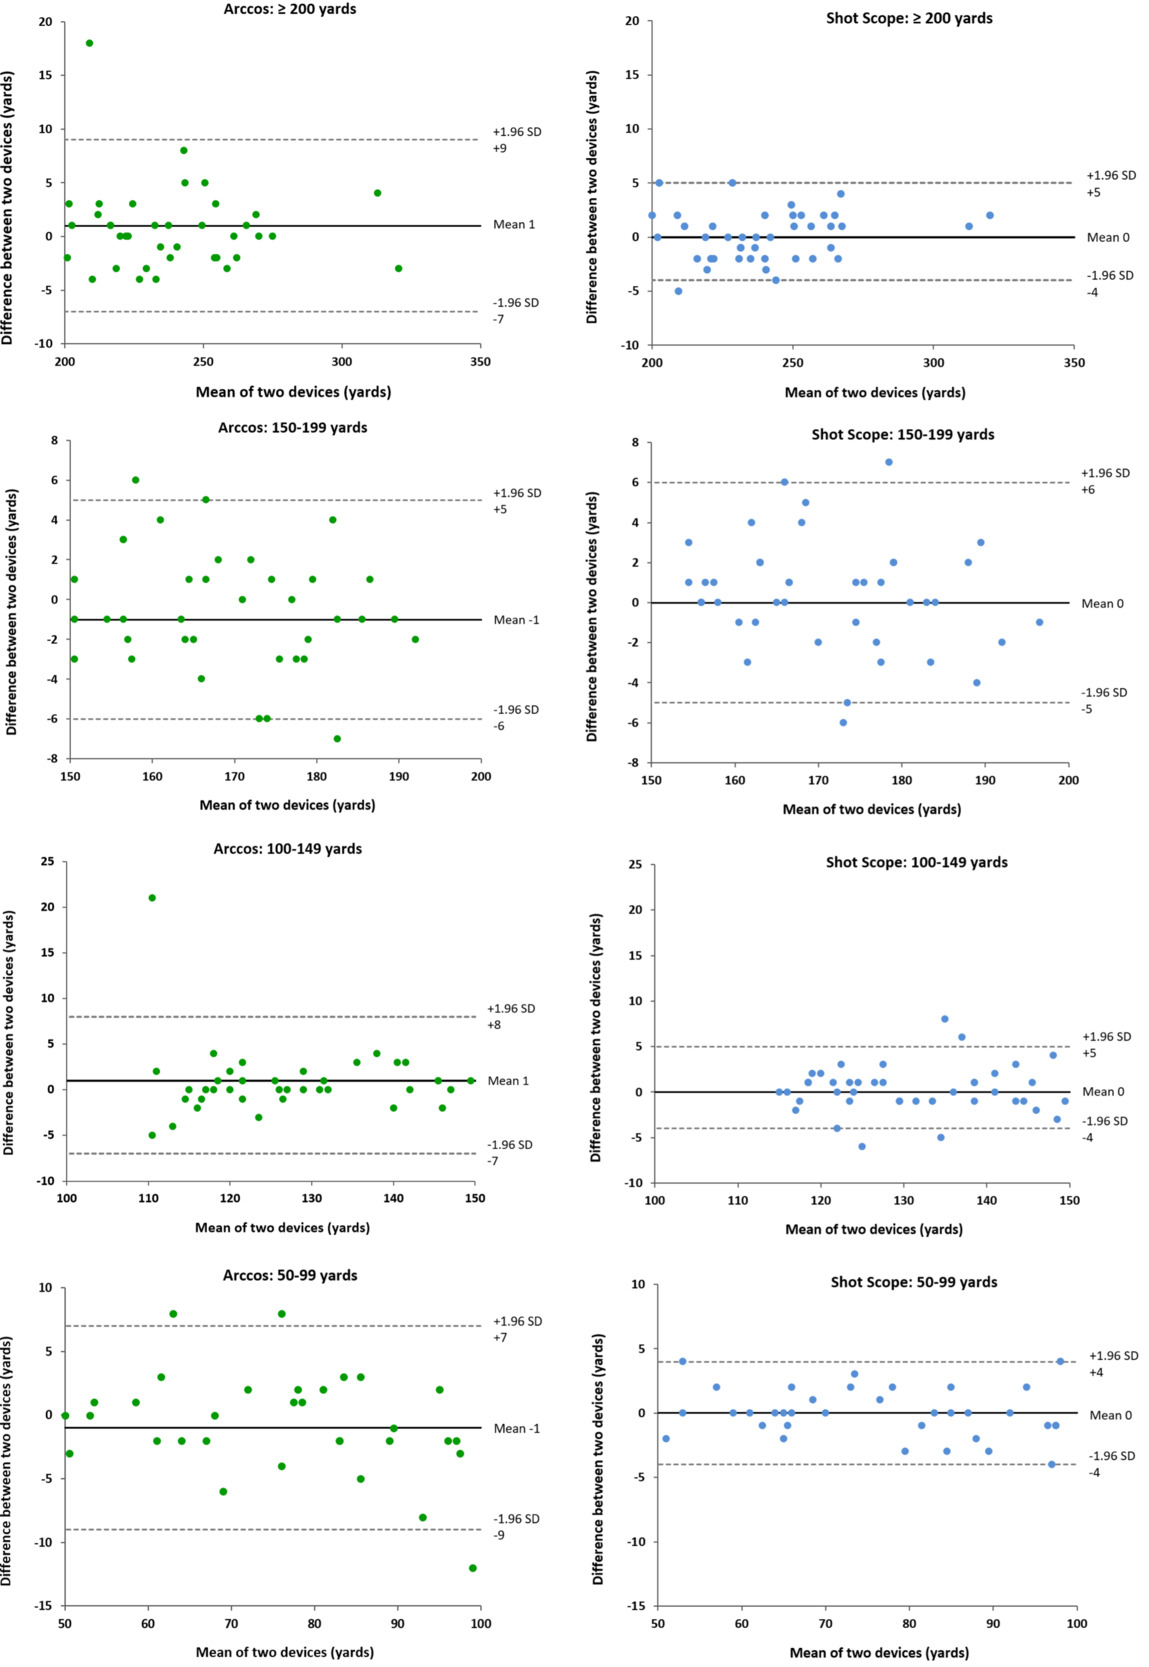
Bland-Altman plots (Figure 3) show that mean bias for all Arccos 1 vs. 2 distance categories are ≤1 yard with 95% LOA ranging between 11-16 yards, and for the Putts, mean bias (95% LOA) was 0 feet (36 feet). For all Shot Scope 1 vs. 2 distance categories, mean bias was ≤1 yard with 95% LOA ranging between 7-11 yards, and for the Putts, mean bias (95% LOA) was 0 feet (19 feet).

Undetected Shots
A total of 1267 shots were recorded during both conditions of data collection. The Arccos system did not detect (i.e., no recognition within the smartphone application that a shot has been played) a total of 67 shots (5.3% of all shots) and the Shot Scope system had 3 undetected shots (0.2%).
Discussion
Overview
The aim of this study was to assess the validity and reliability in measuring shot distance of golf performance-tracking GPS devices, Arccos and Shot Scope. The following sections discuss the results which show both Arccos and Shot Scope systems to be highly valid and reliable measures of golf shot distance.
Validity
This condition compared both Arccos and Shot Scope systems’ ability to accurately record shot distances against a laser and tape measure control method of measuring shot distance. All comparisons across both Arccos and Shot Scope systems revealed ‘strong’ and statistically significant correlations, showing that shot distance measurements recorded by each system were strongly associated to the measurements made by the control measure at every distance category. Additionally, coefficients of determination showed that a high proportion (≥88%) of the variance in shot distance in the control measure could be explained by the Arccos and Shot Scope systems across all comparisons. However, statistically significant differences were found using Wilcoxon signed-rank tests in the 150-199 yards distance category between Shot Scope and Control B, in the 50-99 yards distance category between Arccos and Control A, and Shot Scope and Control B, and in the ≤49 yards distance category between Shot Scope and Control B, all other comparisons displayed non-significant differences. Mean bias for all distance categories remained ≤1 yard, showing that despite statistically significant differences in some comparisons, the variance between each system and their control were low and thus, both systems appear highly valid methods of measuring golf shot distance. These findings build on the work of previous research investigating GPS devices as a valid measure of human movement distance in team sports such as Australian football (Jennings et al., 2010), soccer (Portas et al., 2010), and a field-based team-sport activity (Gray et al., 2010), demonstrating that 1-Hz GPS devices display good validity in measuring distance travelled during both human movement and by golf shots. This is noteworthy given the limited research measuring on-course golf performance. Future research should consider using these devices when seeking to analyse golf performance, thus bridging the gap between science and practice. Further still, since most golf lessons occur on the range or with indoor simulators, there is limited appreciation of a players’ on-course performance. This research is valuable to golfers and golf coaches alike, as it evidences that both Arccos and Shot Scope systems can be used as a valid measure of a golfer’s strengths and weaknesses in the contextually appropriate golf course environment, thus enriching a coaching intervention.
Reliability
The reliability condition aimed to test the interunit repeatability of distance measurements across the same round of golf. Pre-determined boundaries of correlation strength showed that Arccos and Shot Scope systems demonstrated ‘strong’ and statistically significant correlations at every distance category (Table 2). This finding demonstrates that shot distance measurements taken at all distances by Arccos device 1 vs. Arccos device 2 and Shot Scope device 1 vs. Shot Scope device 2 are strongly associated. Additionally, as shown by the coefficients of determination, a high proportion of the variation (≥92%) in shot distance in Arccos 1 and Shot Scope 1 devices can be explained by Arccos 2 and Shot Scope 2 devices respectively, except for the Putts category in the Arccos system which could only explain 72% of the variation.
The TEM is low for both devices (≤3 yards) but, Table 2 clearly demonstrates that when assessing TEM and CV of Arccos 1 vs. 2 and Shot Scope 1 vs. 2 at every shot distance category, typical error and variation are likely greater between two Arccos devices than between two Shot Scope devices. For both Arccos and Shot Scope comparisons, CV appears to increase as shot length decreases (i.e., from shots hit with a driver or long iron to chip shots around the green or putts, see Table 2), with all CV values by distance category classified as ‘good’ except in the ≤49 yards category (Arccos 1 vs. 2 = 14.6%, ‘poor’; Shot Scope 1 vs. 2 = 9.9%, ‘moderate’) and Putts category (Arccos 1 vs. 2 = 69.0%, ‘poor’; Shot Scope 1 vs. 2 = 62%, ‘poor’). However, the authors recognise this may be an artificial inflation of CV because the SD of the bias is larger than the mean bias, the mean biases are small (≤1 yard) and the TEM to mean bias ratio is relatively large. This could suggest that both Arccos and Shot Scope systems are less reliable on shot distances less than 50 yards. These findings have been observed in research investigating 1-Hz GPS devices in other sports. In a simulated team sport running circuit (Jennings et al., 2010) and a simulated cricket-specific locomotion course (Petersen et al., 2009), GPS reliability was found to improve as distance travelled increased. Furthermore, Gray et al. (2010) found reductions in reliability when field-based team athletes changed direction often and at high speed, Portas et al. (2010) found GPS to underestimate distance travelled in confined spaces, and in considering an individual sport application, Sindall et al. (2013) found GPS reliability to suffer during a wheelchair tennis figure 8 drill where movement occurred in a small space with a complex series of turns. It is possible the negative effect on reliability of 1-Hz GPS devices caused by confined spaces in other sport environments is being replicated in the golf environment as the golfer approaches the green. Golf shots near to the green are shorter in length and occur closer together. The golfer may also change direction multiple times on the green if they hit past the hole on their first attempt at holing out. The authors posit the suggestion that shots hit in quick succession within the confined space of the green and surrounds, with multiple changes in direction, may be too complex for a 1-Hz GPS refresh rate and thus account for the decreased reliability observed as shot length decreases. However, it is also recognised that other sports applications are measuring continuous movement, where excessive smoothing of curves due to a low sampling rate will affect the accuracy of the recorded distance measured. In the case of golf performance-tracking technology assessed in the present study, the GPS is being utilised to identify two geographical points (i.e. shot locations) between which distance is measured, hence the sampling rate may not be the cause of the drop in reliability in this case. Further research comparing 1-Hz GPS with the faster-refreshing 5-Hz or 10-Hz GPS in a golf setting would be required to explore this.
Undetected Shots
The technology in the Arccos systems aims to automatically detect when a shot has been hit, removing the need for the golfer to interact with their smartphone during the round. In comparison, the Shot Scope system relies on manual methods. The Arccos system had a greater number of undetected shots (n = 67) when compared to Shot Scope (n = 3). Undetected shots cause several issues when tracking golf performance. An example from the reliability data shows the following: Arccos 1 recorded five shots on a particular hole; 1) 189 yards 2) 150 yards 3) 19 yards 4) 7 yards, and 5) 1 foot, whereas Arccos 2 recorded four shots on the same hole 1) 327 yards 2) 17 yards 3) 7 yards, and 4) 1 foot. The second shot went undetected on the Arccos 2 system resulting in an inaccurate score for that hole and an inaccurate distance measurement for shot 1 because it measured from shot 1 directly to shot 3. Because Arccos is designed to minimise interaction with the smartphone, undetected shots can be rectified at the end of the round using in-built functionality within application – a heat map of movement around the golf course can be viewed and shots can be manually added to the approximate location of where that shot was played. Similarly, shots can be added retrospectively using the Shot Scope smartphone application and because the smartphone is used for every shot, undetected shots can be identified sooner. The final score is corrected this way and all shots hit are present in the round summary and statistics within the smartphone application. However, for the purposes of the present study, the authors decided this retrospective manual adjustment was not a scientifically appropriate solution to dealing with undetected shots and instead, they should be taken into consideration when assessing the respective systems.
The authors subsequently decided to remove all cases including an undetected shot from data analyses and all shots directly affected by an undetected shot, as they were not comparable and would have artificially interfered with the results. In total, 108 shots or 8.5% of the data set were removed from analysis for this reason. This is not seen as a limitation to the study but rather reveals important insight into the reliability of the systems besides their distance measuring capability.
The few shots that went undetected by the Shot Scope system were explained by researcher error: they missed tapping the sensor on their smartphone and walked on before realising their mistake, unable to return to the exact location of the shot, which could reasonably occur to a golfer using the Shot Scope system. The cause of the undetected shots in the Arccos system is unclear, but one possible explanation is failure of the algorithm wherein it has not recognised the pattern of sound, vibration and GPS data as a shot, or a shorter and less forceful swing has produced insufficient sound/vibration, and the shot has not been recorded. There exists then a potential compromise between accuracy and convenience in these GPS performance-tracking devices with each system being more suitable for different purposes. For example, an amateur golfer looking to gain insight into their performance for the purposes of improvement and enjoyment may value the convenience of the automation offered by the Arccos system, accepting that some shots may go undetected but can be reasonably added using the in-built features after the round. Whereas, for scientific research applications, where data completeness outweighs convenience and user experience, the Shot Scope may be favoured.
A further study may be required to understand if the undetected shots in the Arccos system were anomalous to this study, or if this can be expected by the consumer during regular use. If the pattern is replicated, future studies should measure the effect on validity and reliability of retrospectively adding undetected shots using the in-built functionality of each smartphone application.
Limitations
It was not obvious in the smartphone application that the Arccos system changed from measuring distance hit to distance remaining once on the green, this fact was confirmed to the authors after data collection had begun. Hence, 63 putts were removed from the validity condition data.
One shot was identified as an outlier and removed from the Shot Scope reliability analysis as it was drastically different in bias to any data around it or across the whole Shot Scope data set. An investigation into the smartphone application record of that shot provided little insight as to the cause of it and the authors decided after deliberation that it was likely an error and should not be included in the analyses.
Conclusions
This is the first study to explore the validity and reliability of golf performance-tracking GPS devices for measuring shot distances on-course. The results demonstrate that both Arccos and Shot Scope systems display high levels of validity across all distance categories in golf shot distance measurements when compared to a control measure. Furthermore, both Arccos and Shot Scope systems appear highly reliable across all distance categories when comparing interunit differences in shot distance measurements. Reliability appears to decrease as shot length decreases in both Arccos and Shot Scope systems, and the Arccos system had a greater number of undetected shots in comparison to the Shot Scope system. The results of this study demonstrate that these GPS devices present a low-cost method of collecting accurate on-course golf performance data.
Statements and Declarations
This research is part of a PhD scholarship match-funded by the European Disabled Golf Association (EDGA) and Anglia Ruskin University, Cambridge. The authors have no other financial or non-financial interests to declare.
Acknowledgements
This research is part of Thomas Hall’s wider PhD project on golfers with a vision impairment which has been commissioned by the European Disabled Golf Association (EDGA) and match-funded by Anglia Ruskin University, Cambridge. The authors would like to thank; EDGA for their support of this research, Arccos Golf LLC, and Shot Scope Technologies Ltd. for providing their technology free of charge, The Gog Magog Golf Club and Girton Golf Club for graciously accommodating us on their courses during collection, Replay Golf (Surrey, UK) for providing a set of golf clubs for data collection, and Ben Eidmans, Ben Merritt-Timms, Ciaran Grenyer, Luke Herholdt, Marcus Opoku, Martina López Rodriguez, Matt Slater, Oban Sawle, and Rafaal Abdul Bari for their assistance in collecting data.