


Introduction
The Professional Golfers Association (PGA) of GB&I employ the ‘Laws’, ‘Principles’ and ‘Preferences’ model (Wiren, 1990) to help coaches and custom fitters identify the links between the ball flight, impact conditions (Laws), and swing mechanics (Principles). Observations of the ball flight are therefore central to diagnosing impact variables and informing technical or equipment related interventions. In addition to environmental factors which can influence the ball during flight (i.e. a cross-wind), changes to the conditions of the clubface have also been observed to affect the underlying physics of the collision. For instance, materials or moisture trapped between the club and the ball can significantly affect the spin of the ball (Dewhurst, 2015). Given that the ball is only in contact with the clubhead for less than 0.5 ms (Penner, 2001), the collision is too finite to understand without technology or field-based alternatives. As such, PGA Professionals utilise a variety of methods to garner a greater understanding of impact and thus ball flight.
Advancements in technology have allowed for real-time assessment of impact and ball flight using launch monitors such as TrackMan and Foresight (e.g GCQuad). Although these launch monitors can provide accurate data on ball flight and impact (Brennan et al., 2024; Leach et al., 2017), they can be prohibitively expensive and are affected by user errors such as the placement of face markers. As such, PGA Professionals’ often utilise simple field-based alternatives such as face tape. This method is advantageous as a practical way for custom fitters and technical coaches to measure strike location. Indeed, research advocates the use of face tape suggesting it provides a simple yet reliable opportunity to measure impact location (Corke et al., 2019). However, although face tape provides an indication of centredness of strike, the application of this tape has been suggested to directly change the materialistic properties of the face which can impact the ball flight (Corke et al., 2019). Furthermore, when face tape is removed it leaves a residue of adhesive on the face, which could also affect the interaction between the clubhead and the ball. If face tape residue does affect the ball flight, it could influence decisions made by coaches and custom fitters, potentially leading to suboptimal equipment choices and diminished on-course performance. However, the effects of face tape residue on the ball fight remain unsubstantiated.
When considering the collision of the golf ball and clubhead, the physics of the collision and the face condition directly influence friction, spin and overall launch characteristics. When a higher lofted club (i.e. a 7-iron) strikes the ball, the impact can be divided into two phases: sliding and rolling (Cochran & Stobbs, 1968). Initially, the ball slides upward across the club face and at the same time is compressed slightly. As friction takes hold, this sliding begins to transition into rolling. At the moment the ball stops sliding entirely and rolls purely, it reaches its maximum spin rate. From this point until separation, spin rate typically decreases until the ball leaves the club face. However, this idealised sequence does not always occur and with higher lofted clubs and under certain conditions, particularly in wet conditions or environments where grass is more likely to interfere with the interaction between the club and ball, the ball may not fully transition into rolling, disrupting spin generation. For example, Cornish, Otto, and Strangwood (2008) observed that the presence of moisture between the ball and clubface increases the launch angle and reduces spin rates with lofted clubs (e.g. 7-irons). This is likely due to a decrease in surface friction, which prevents the ball from gripping effectively (Dewhurst, 2015). In such conditions, the role of grooves becomes even more critical in preserving spin potential by helping to channel debris and maintain contact between the ball and face.
Interestingly, under certain conditions, reduced friction has been shown to increase spin, but this effect appears most pronounced with clubs that have lower static lofts. Studies by Lieberman (2010), the R&A/USGA (2007), and Dewhurst (2015) demonstrate that lower friction can sometimes lead to higher spin rates with long and mid-irons, such as a 5-iron. Dewhurst, for example, identifies a range of lofts (35°–37°) and clubhead speeds (109 mph, 81.8 mph, and 68.2 mph) where spin becomes less predictable, potentially explaining the variability seen in certain test scenarios.
It is important to note that while static loft refers to the built-in angle of the clubface, spin loft, a term coined by TrackMan (2025a), describes the three-dimensional angle between the direction the club head is moving (both club path and angle of approach) and the clubface normal at impact. It is this spin loft that ultimately governs how much spin is generated at a given moment. Therefore, when interpreting these findings, it is more accurate to view any change in spin as a result of spin loft dynamics, rather than attributing them solely to static loft. These findings, though rooted in on-course shot behavior, are highly relevant when evaluating data collection environments. If face tape or residue alters the friction profile of the clubface, it may influence launch and spin characteristics in ways that compromise measurement accuracy. This could in turn lead to inappropriate fitting recommendations or practice priorities, particularly when working with clubs near the critical thresholds for spin variability.
While previous research highlights that material caught between the clubface and the ball affect the launch conditions of the golf ball, there is no research assessing the effects that face tape and face tape residue has on ball flight with different lofted clubs (i.e. 5-iron and 7-iron). Therefore, the aims of this original research were to assess the effects of three different clubface conditions, namely 1) clean, 2) face tape and 3) residue on ball flight characteristics for a 5-iron and 7-iron. It is hypothesised that there will be significant differences in ball flight characteristics between each of these conditions.
Methods
Participants: A total of 20 golfers (17 males: age: 20.6 ± 2.6 years; mass: 76.7 ± 32.2 kg; height: 1.81 ± 0.15 m; handicap: 3.5 ± 6.6 and 3 females: age 20.3 ± 0.7 years; mass 70.9 ± 10.1 kg; height 1.6 ± 0.01 m; handicap 3.2 ± 2.8) volunteered to participate in this investigation. Participants were recruited via convenience sampling and completed informed consent and a Physical Activity Readiness Questionnaire prior to engaging in the investigation. All participants were injury free and were asked to avoid alcohol consumption 24 hours prior to testing. Participants height was measured using a Leicester Height Measure (Marsden Group, Loughborough, UK) with mass assessed using Salter Razor Electronic scales (Salter, Kent, UK). Inclusion criteria required participants to have a handicap of ≤10 strokes. This handicap level was decided to ensure a balance between lower levels of intra-swing variability and skill level (Betzler et al., 2012). Left-handed golfers were also excluded from the experiment due to the design and custom build of the clubs. Approval for this investigation was granted through the University Ethics committee.
Club design: Four 7-irons and four 5-irons were each built to identical specifications (Table 1) by an experienced custom fitter (>13 years fitting) based at The Professional Golfers’ Association (The Belfry, Warwickshire, UK). All clubs conformed to R&A and USGA equipment standards. One 7-iron and one 5-iron were labelled as “practice” clubs and were only utilised for familiarisation purposes within the investigation. The three remaining 7-irons and 5-irons consisted of one with a clean clubface, one with face tape (LongShot Golf, Michigan, USA), and one with adhesive residue from the removal of face tape (i.e. residue condition). Subjects were blinded to the clean clubface and residue condition; however, they were unblinded to the face tape condition as this was visible on the clubhead.
This study adopted an ecologically valid approach by simulating how adhesive residue accumulates on the clubface through repeated impacts, reflecting typical coaching and fitting environments. A PGA Professional and a moderately skilled player (handicap = 18) each hit 100 shots with the 7-iron, with fresh face tape applied every 10 shots to incrementally build up residue. This process was then repeated using the 5-iron. By applying the residue through actual impacts, rather than artificial application, the procedure closely mirrored how adhesive would accumulate during normal use. Testing across a range of strike locations and skill levels, as centredness of strike naturally varies between players (Betzler et al., 2012), further ensured the data reflected real-world variability. These design choices ensured the methodology realistically represented the conditions encountered by coaches and custom fitters.
Procedures: A counterbalanced design was employed for this investigation. For clarity, the ordering in which the participant struck shots with each club was varied. This was to ensure that sequence of ordering did not affect the results. For instance, participant one would hit each club in the following order, 1) clean, 2) face tape, 3) residue. The order of clubs was then rotated for participant two meaning that their sequence was 1) face tape 2) residue 3) clean. The club order for each subject was held consistent between the 7-iron and 5-iron. For instance, if subject three’s order for the 7-iron was 1) residue, 2) clean, 3) face tape, this order would be the same for the 5-iron. For the face tape condition, a fresh layer of tape was applied to the clubface for each participant. In the residue condition, the adhesive residue from previously applied tape was left on the clubface. Researchers did not add or remove any adhesive throughout the study. This allowed the residue condition to evolve naturally, reflecting how buildup would typically develop over time in a real-world fitting environment. All experiments were carried out at The Professional Golfers’ Association (The Belfry, Warwickshire, UK) using new premium range balls (Srixon, UK).
Prior to data collection, participants performed their own warm-up and hit a self-selected number of familiarisation shots (n = 6.7 ± 1.85) with the practice 7-iron. This was to ensure that participants were accustomed to the fitting of the club. Each shot was hit from a golf mat with a specific target line determined by the researcher using range balls. Before the experiment commenced, the balls were examined for defects or general wear and removed from the experiment if not found to be in good condition. This was to ensure all data gathered was a result of the independent variables (i.e. face condition), rather than variations in the golf ball. Verbal instructions were to “hit the ball for distance whilst maintaining accuracy if you were playing in tournament conditions”. Participants were told to avoid touching the clubface and to ‘pick and place’ the balls rather than rolling them onto the golf mat with the club. This was to ensure that the residue was not affected from dragging the club along the floor. Six shots were hit in each of the experimental conditions (i.e. clean, face tape and residue) totalling 18 shots. This process was then followed by the 5-iron using the same procedures with a total of n = 4.9 (± 2.32) familiarisation shots hit with the practice club. This order was decided as it is representative of what would typically occur during a practice session.
Club and ball flight data were measured using a TrackMan 4 (Interactive Sports Games, Denmark). The TrackMan variables and definitions measured within this investigation are displayed in Table 2. The purpose of this investigation was to assess if different clubface conditions affect ball launch characteristics, however, it was deemed important to measure impact parameters since these directly affect the launch of the ball (Betzler et al., 2014). These were measured to ensure that any changes in ball flight were attributed to the face condition rather than the golfer varying impact. The TrackMan launch monitor was set up based on the manufacturer’s guidelines and set to “normalise”. This feature was utilised to ensure differing weather conditions did not influence ball flight data within the testing session. The TrackMan is able to measure ball velocity within 1 mph 98% of the time and spin rate to within 150 rpm 97% of the time when compared to a reference system (Leach et al., 2017).
Stats analysis
The coefficient of variation (CV) and the median absolute deviation (MAD) were employed to assess the level of within-subjects variability for impact factors and ball flight. For variables that are centred close to zero (i.e. launch direction) the MAD statistic was employed given that the CV is too sensitive to data centred close to zero (Betzler et al., 2012). Each participant presented their own MAD and CV value for specific impact and ball flight data which were then pooled to provide an overall value for each of the three club conditions (see Table 3). A Multifactorial Analysis of Variance (MANOVA) was employed to assess the differences between groups. Given that this investigation sought to assess the effects of face condition on ball launch conditions, only ball launch conditions were assessed initially within the MANOVA. Based on the suggestions of Field (2024), a separate MANOVA was then employed to assess if any changes existed in impact factors between the three conditions. This allowed any changes in ball flight to be attributed to the face condition as opposed to variations in impact factors. The assumptions of covariance matrices were assessed using Box’s M Test, with significance set at p<0.005 based on the suggestions of Huberty & Petoskey (2000). Post-hoc analysis was computed using Fisher’s least significant difference (LSD) given that MANOVA is robust to type-1 errors. All data analysis was completed using IBM SPSS (version 29.0; Chicago, USA), with statistical significance set as p≤0.05. Owing to the issues of only assessing the p value, the size of the effect was determined using partial eta squared (ηp2). The size of the effect was determined as small = ≤0.0099, medium = 0.01 to 0.0588, and large = ≥0.0589 based on the suggestions of Richardson (2011). A CV% of <10% was deemed as acceptable based on the suggestions of Cormack et al., (2008)
Results
5-iron – impact factors: The assumption of Box’s M trace was not met; therefore, Pillai’s trace was employed as a multivariate test. Using Pillai’s trace there was no significant effect of clubface condition on impact factors V = 0.061, F(10, 108) = 0.339, p=0.968, ηp2 = 0.073 (Table 4).
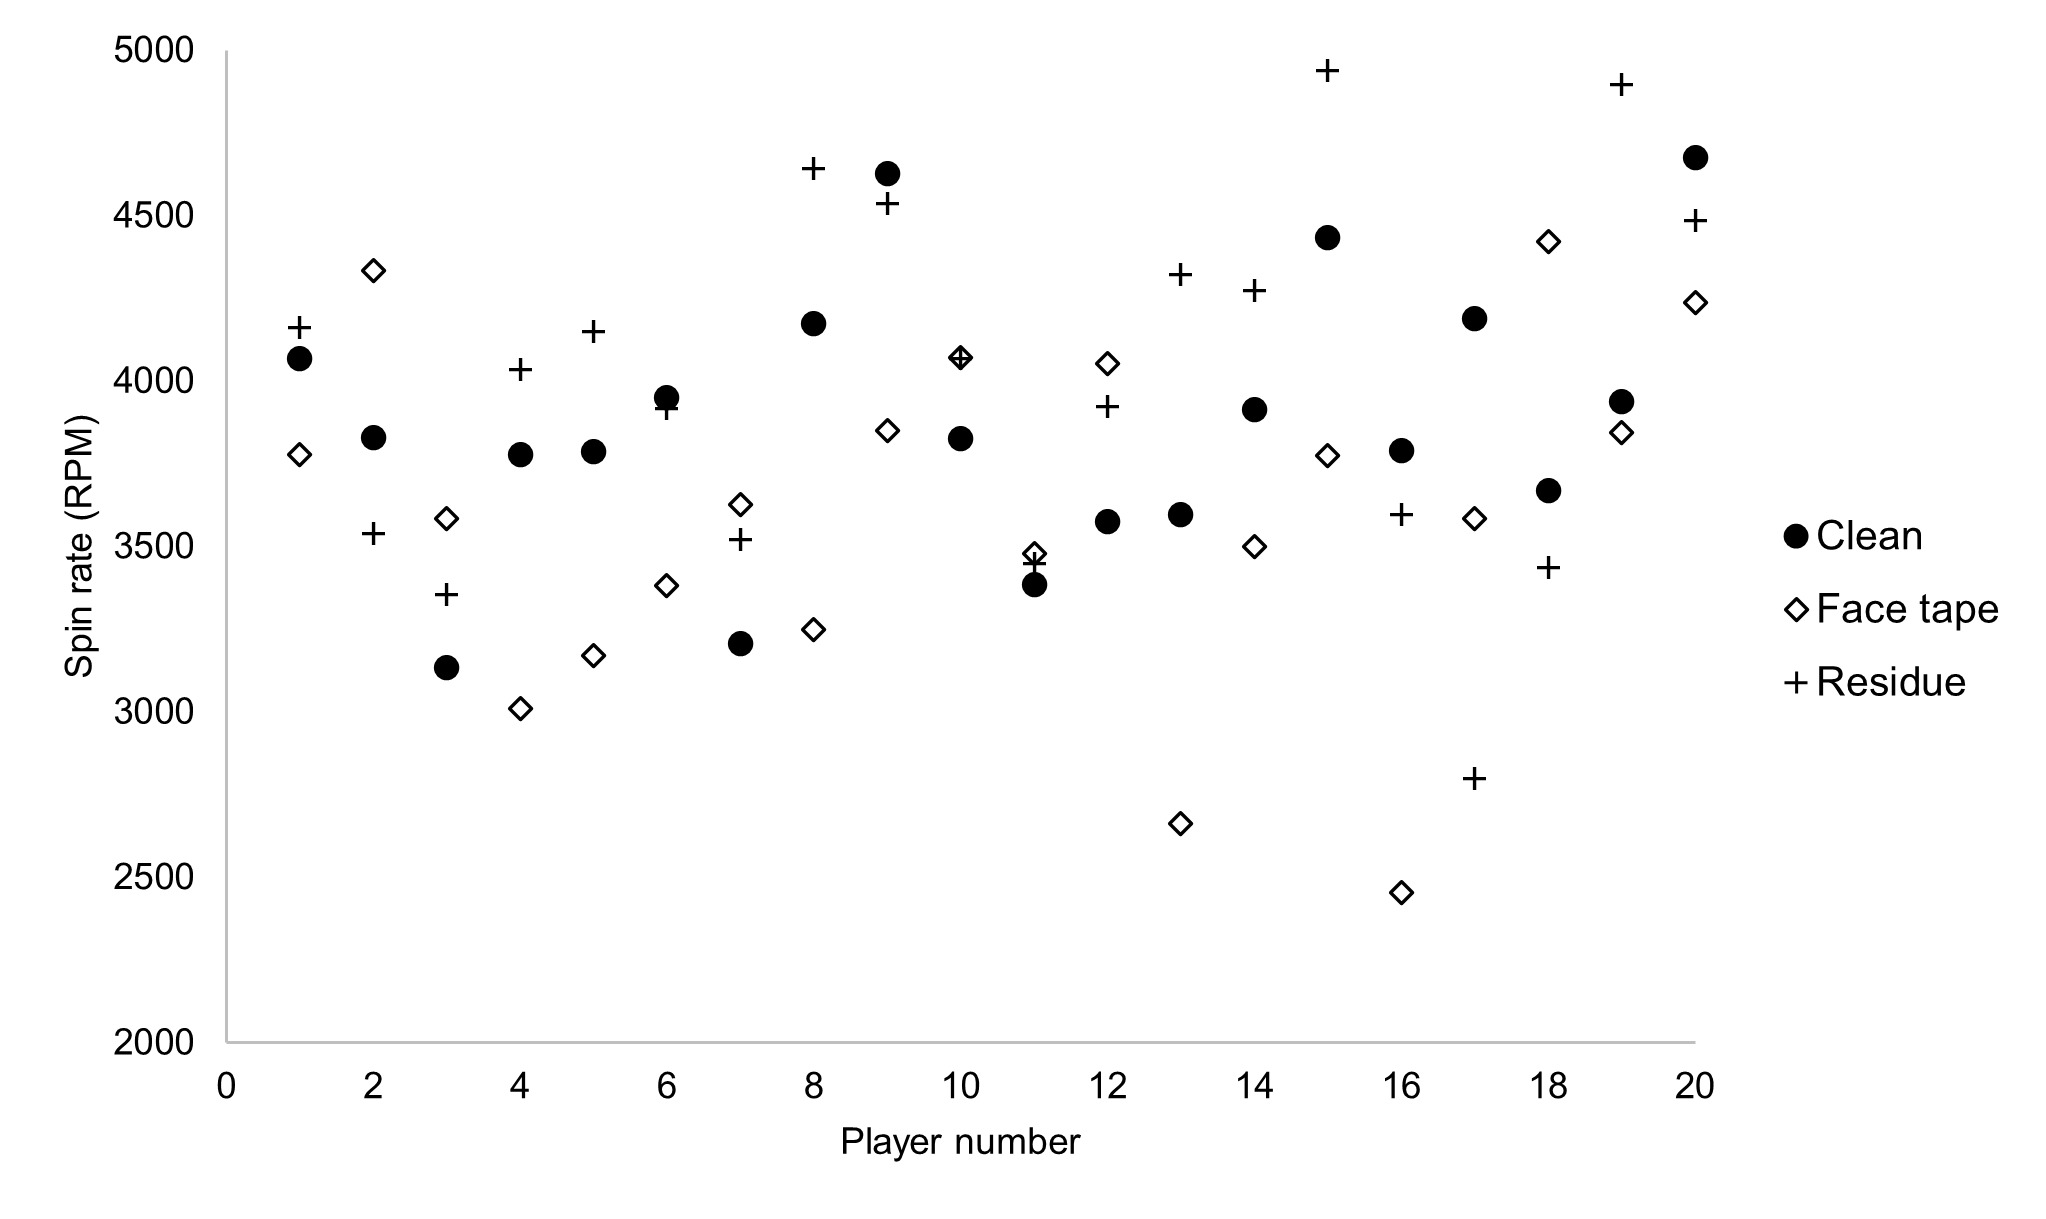
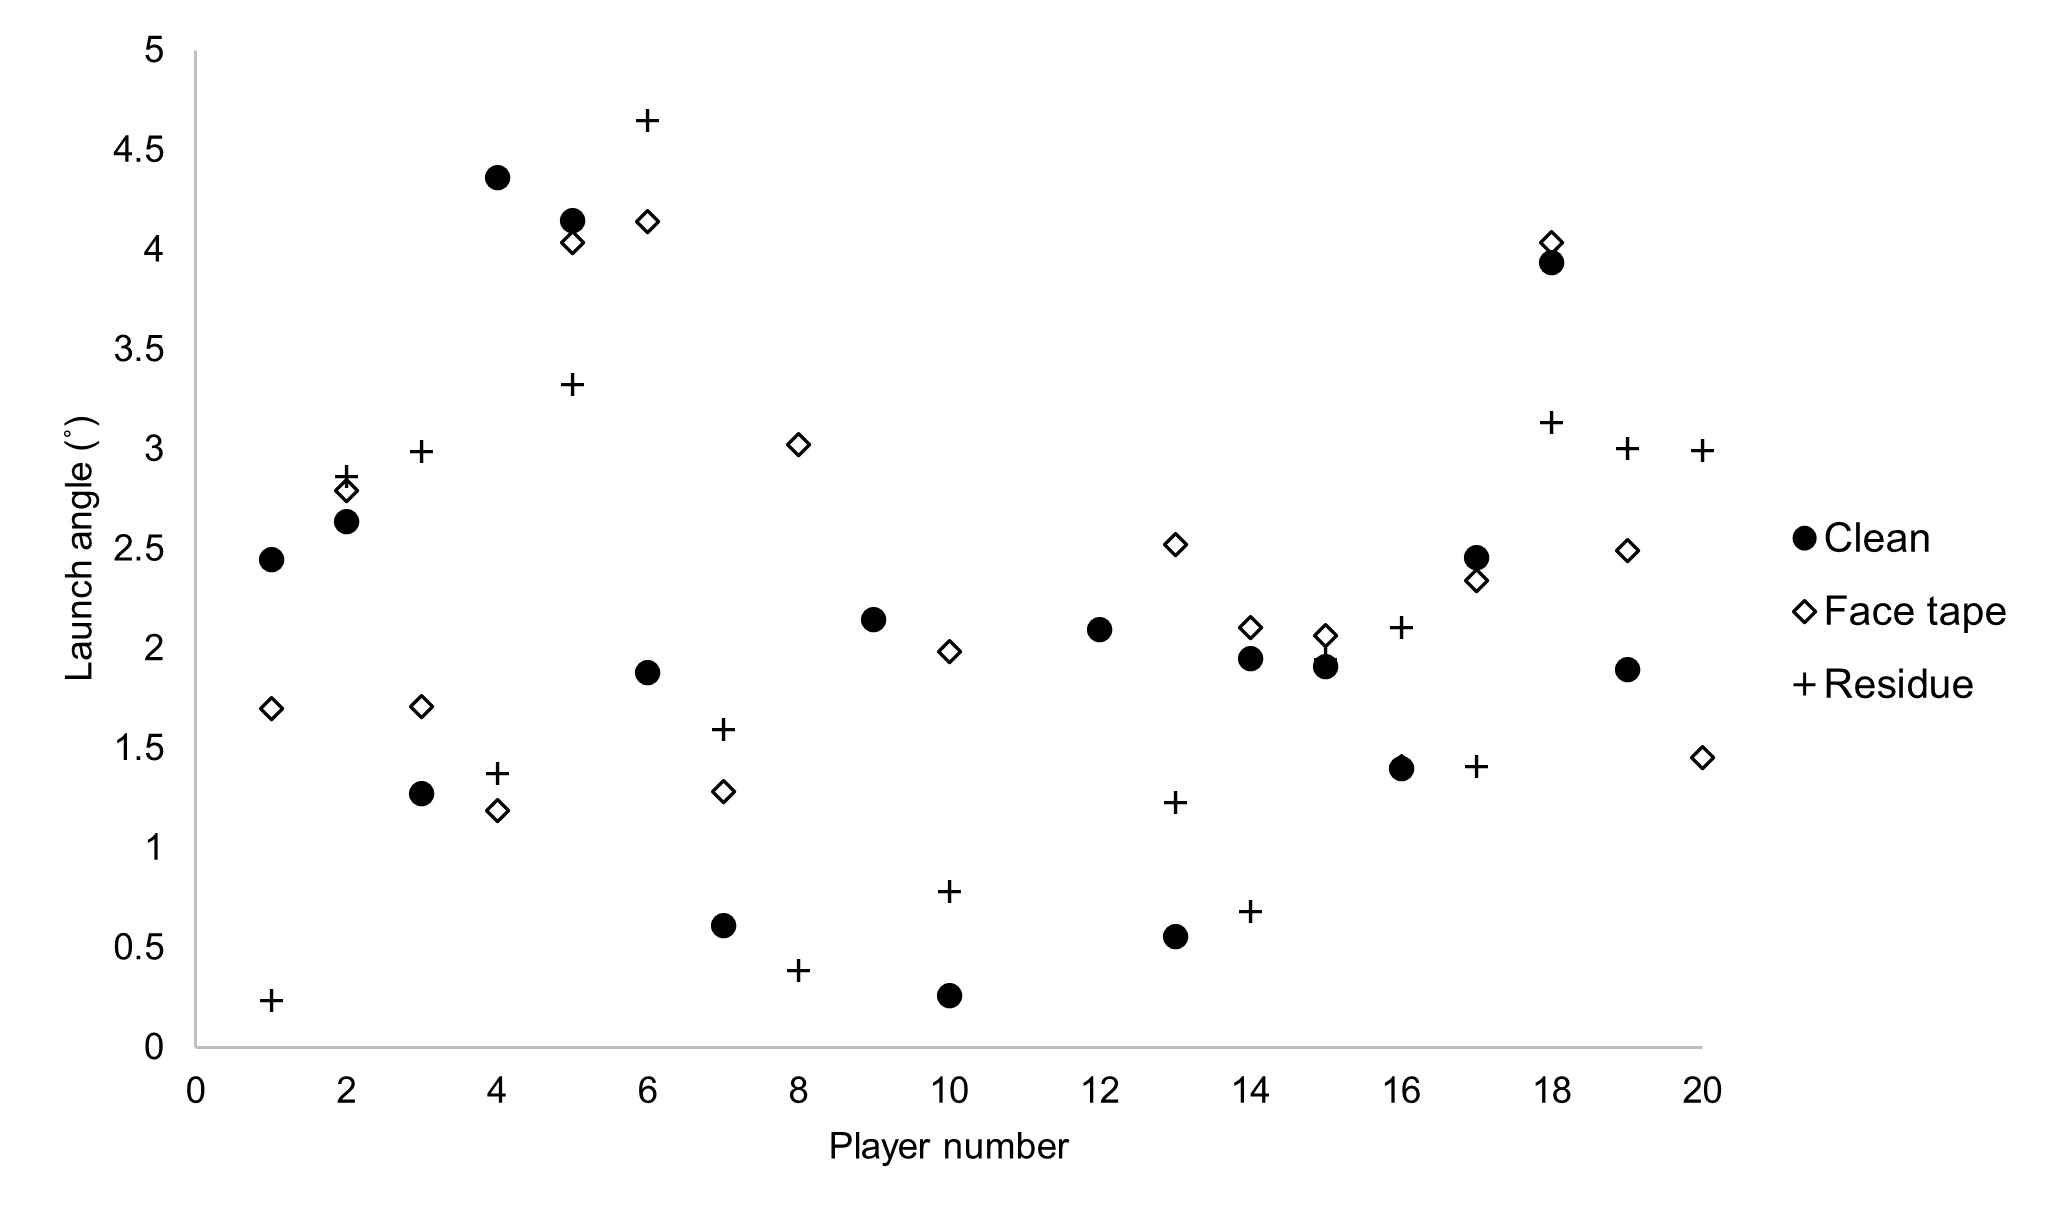
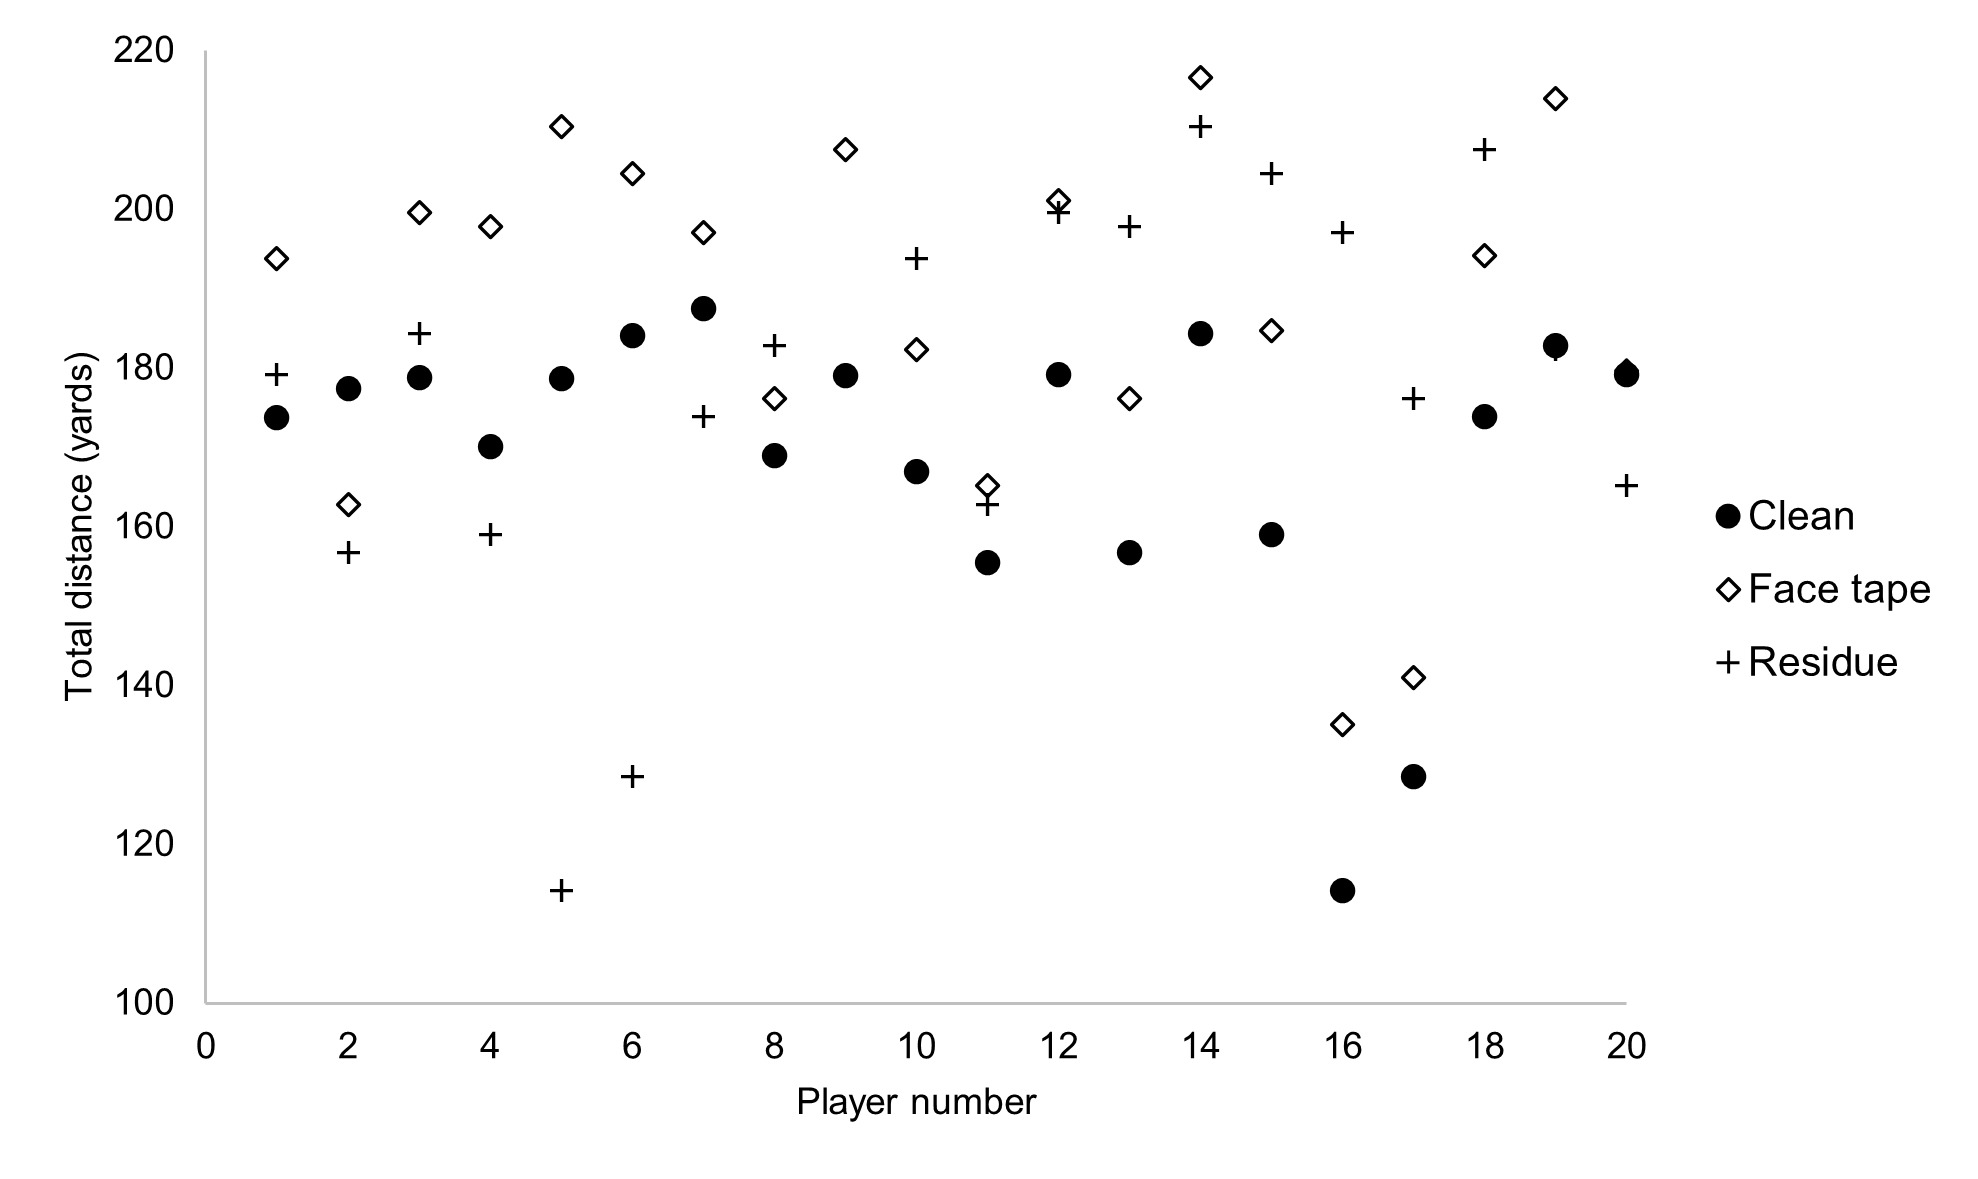
5-iron – ball launch conditions: Aside from spin rate, which had a greater threshold than a CV = 10%, all data were deemed reliable (see Table 3). The assumption of Box’s M trace was not met; therefore, Pillai’s trace was employed as a multivariate test. Using Pillai’s trace there was no significant effect of clubface condition on ball launch conditions V = 0.257, F(16, 102) = 0.942, p=0.392, ηp2 = 0.073 (Table 4).
7-iron – impact factors: The assumption of Box’s M trace was not met; therefore, Pillai’s trace was employed as a multivariate test. Using Pillai’s trace there was no significant effect of clubface condition on impact factors V = 0.145, F(10, 108) = 0.845, p=0.586, ηp2 = 0.073 (Table 5).
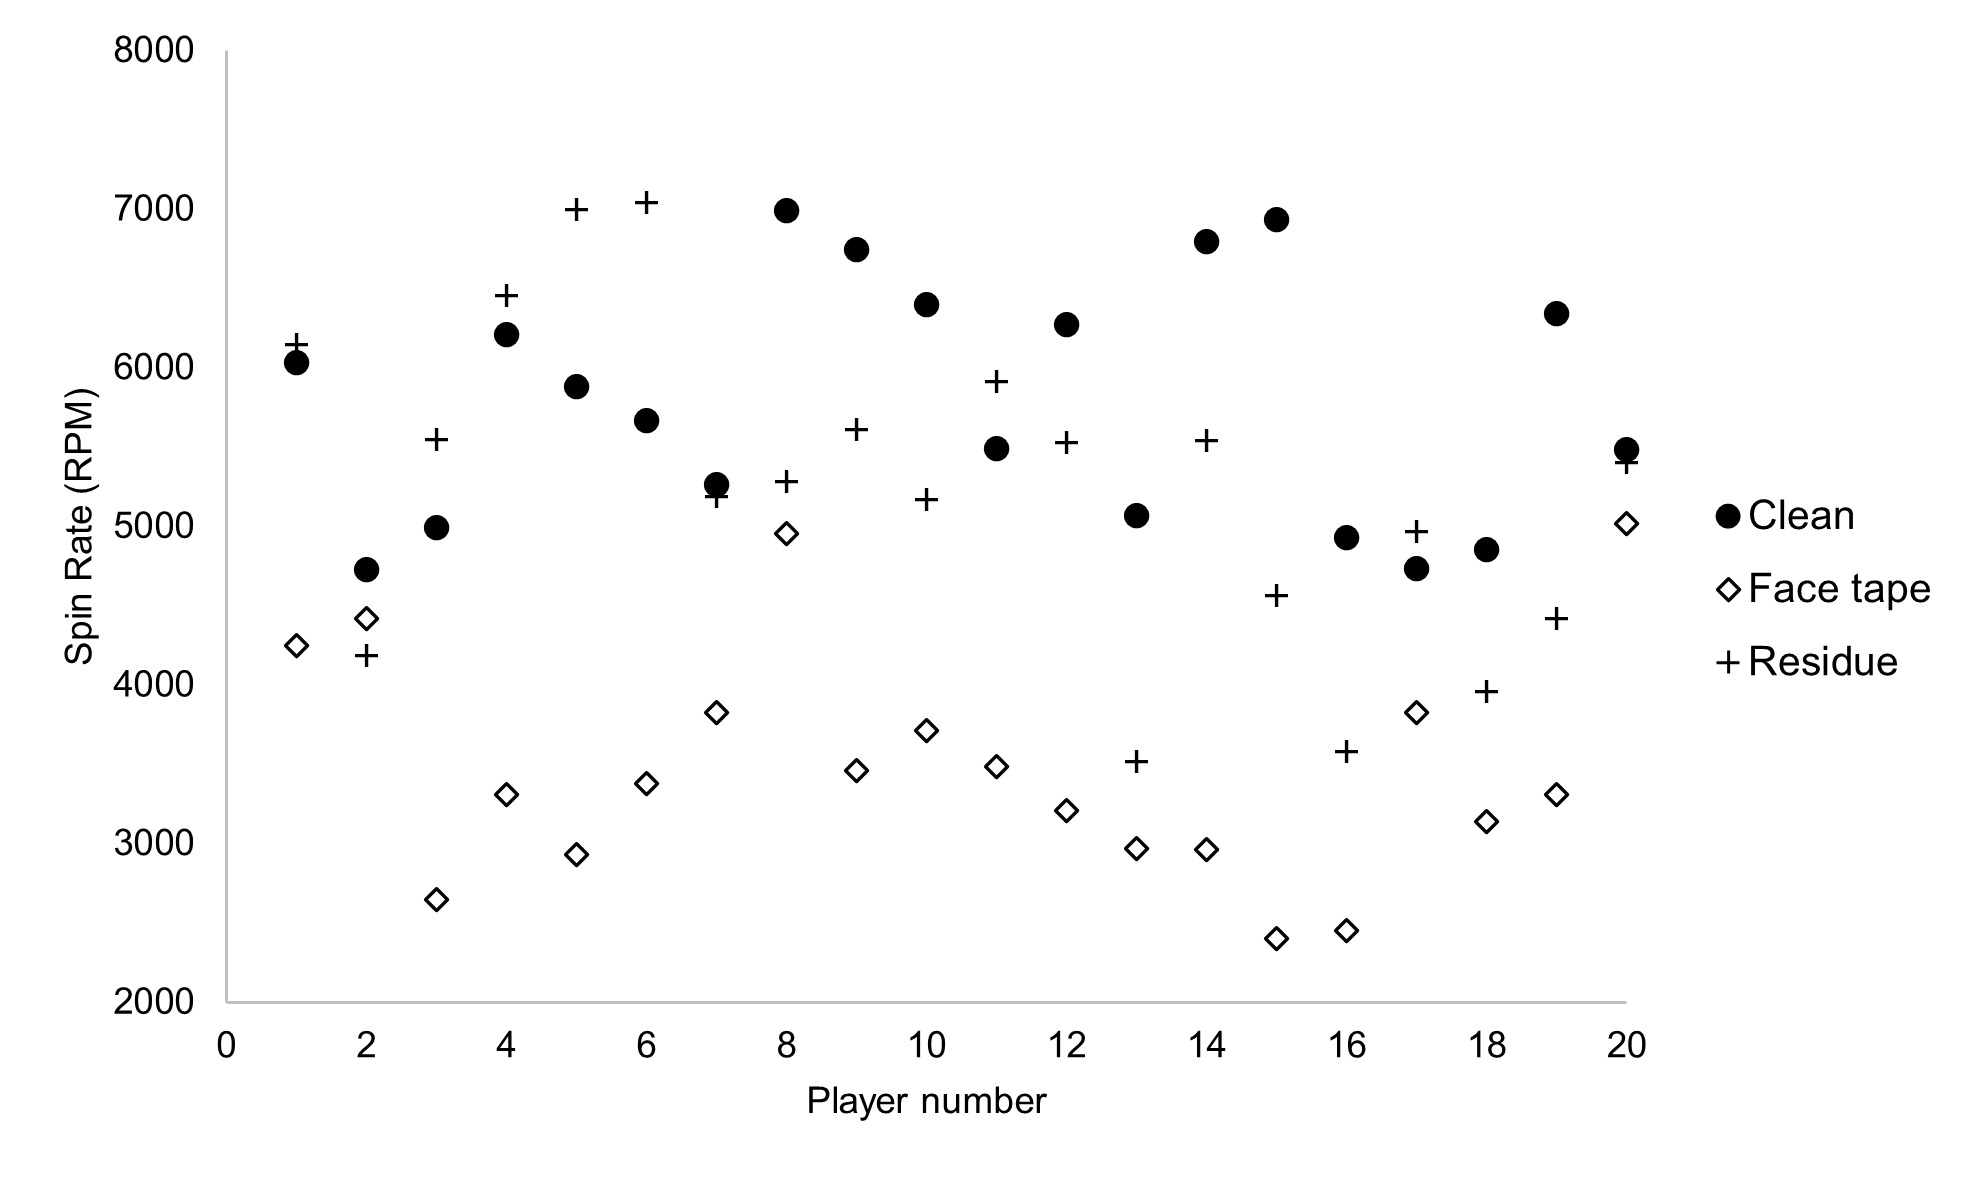
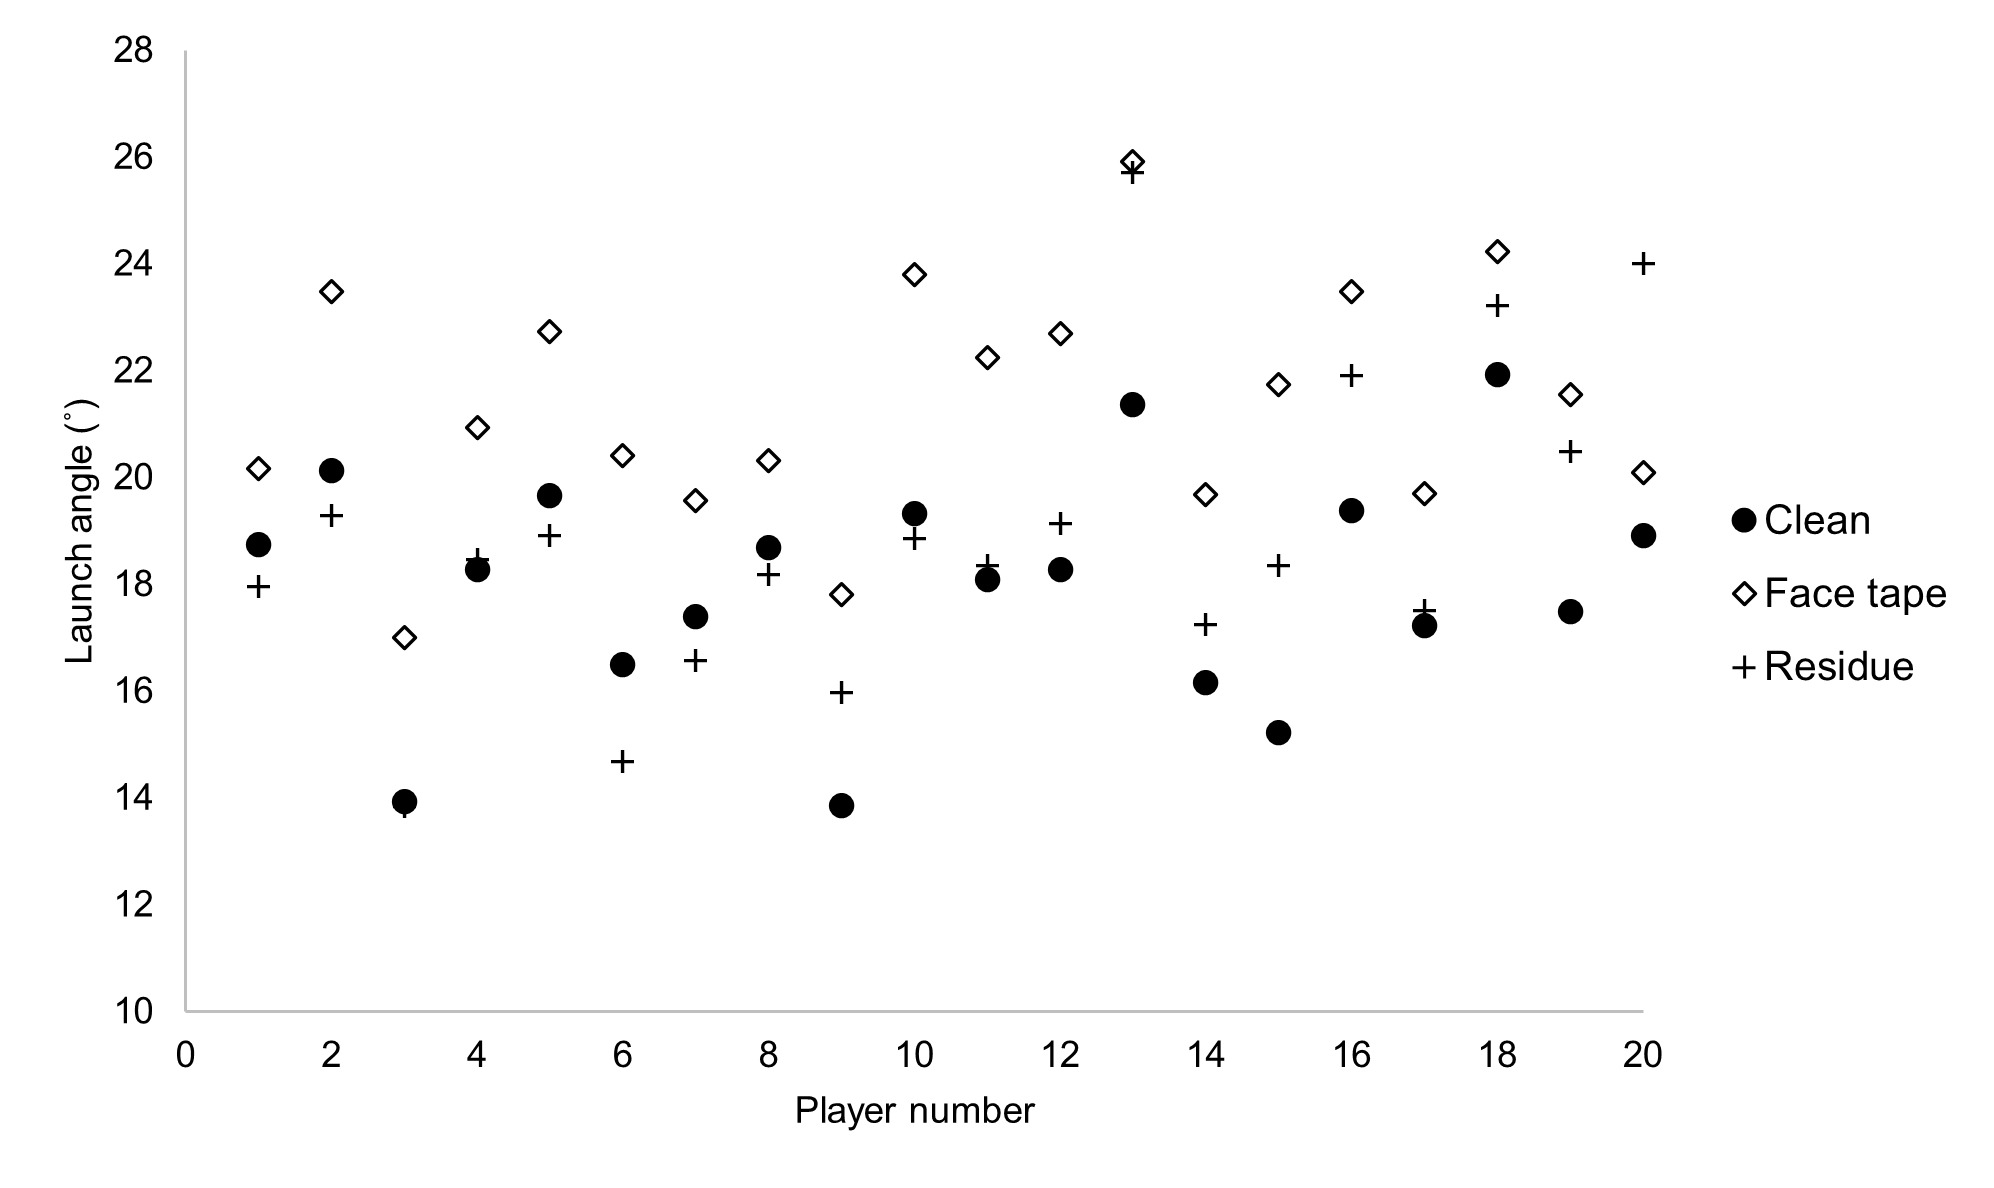
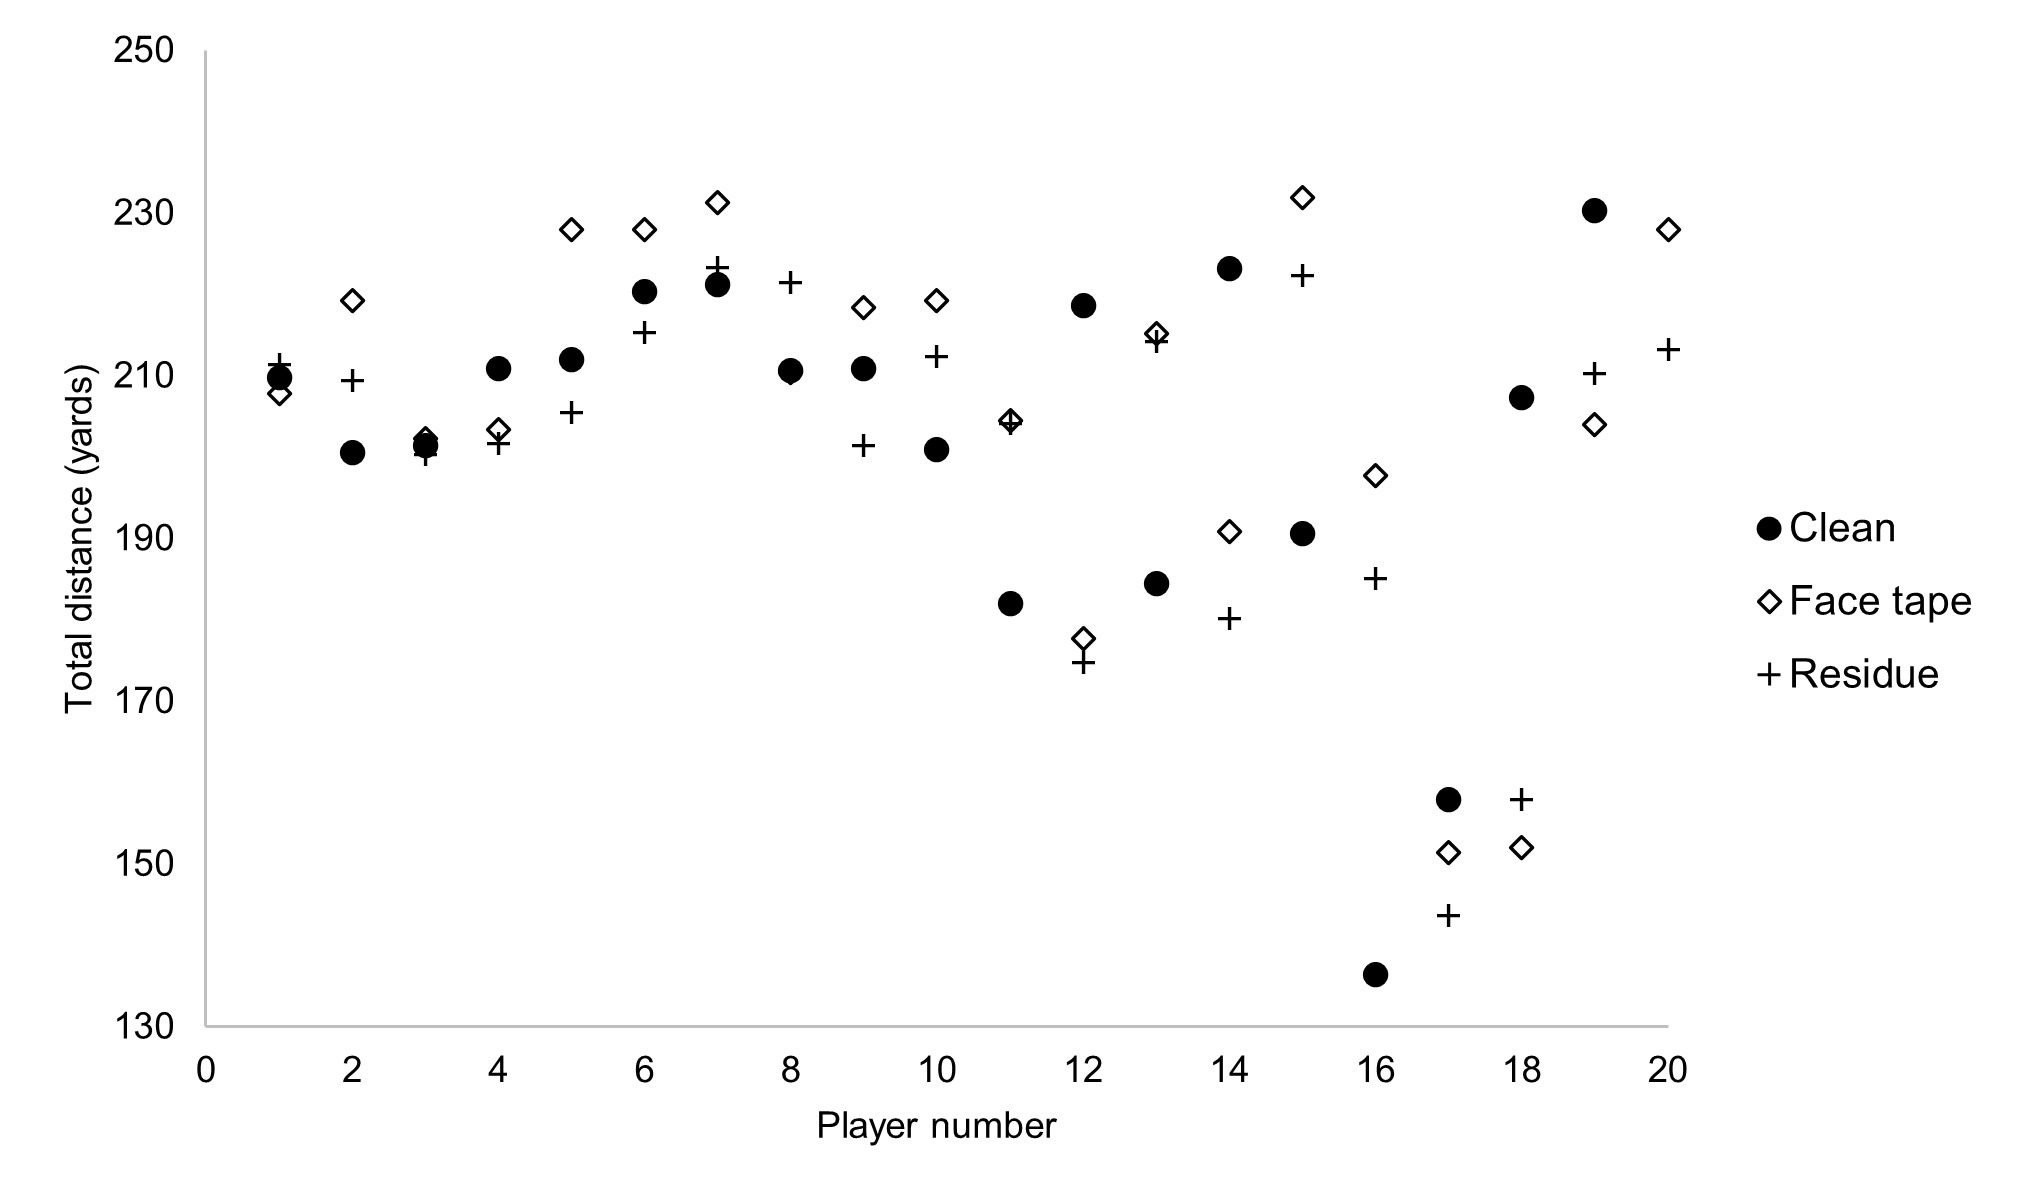
7-iron - ball launch conditions: Aside from spin rate, which had a greater threshold than a CV = 10%, all ball flight data were considered reliable (see Table 3). The assumption of Box’s M trace was not met; therefore, Pillai’s trace was employed as a multivariate test. Using Pillai’s trace, there was a significant effect of the clubface condition on ball flight data V = 0.736, F(12, 106) = 5.145, p<0.001, ηp2 = 0.368 (Table 5). Separate univariate ANOVAs on ball launch conditions revealed significant face condition effects on launch angle F(2, 57) = 9.809, p<0.001, ηp2 = 0.256, spin rate F(2, 57) = 40.664, p<0.001, ηp2 = 0.588, and total distance F (2, 57) = 4.991, p=0.01, ηp2 = 0.149. All other ball launch conditions were not significantly different within the univariate analysis.
Fisher’s LSD analysis indicated that launch angle was significantly greater in the face tape condition (21.38˚) when compared to both clean (18.03˚, p<0.001) and residue (18.94˚, p=0.002) conditions. There were no significant differences between the clean and residue condition. In addition, there were significant differences in spin rate between all three conditions. Greater spin was generated when comparing the clean condition (5790.51 RPM) with the face tape (3482.58 RPM, p<0.001) and residue (5250.64 RPM, p=0.048) conditions. In addition, the residue condition generated significantly greater spin (p<0.001) when compared to face tape. There were also significant differences in total distance when comparing face tape (186.96 yards) to the clean (168.93 yards, p=0.006) and residue (170.81 yards, p=0.013) conditions. There were no significant differences between the clean and residue conditions.


Discussion
The aims of this investigation were to assess the effects of three different clubface conditions, namely 1) clean, 2) face tape and 3) residue on ball flight characteristics using a 5- and 7-iron. The purpose was to determine whether these conditions, commonly encountered during custom fittings or coaching sessions, meaningfully impact performance data. To ensure that any changes in ball flight were attributed to face condition, impact factors were also measured. There were no significant changes in any of the impact factors in each of the conditions for both the 5-iron and 7-iron, as such, any changes in ball flight can therefore be attributed to the conditions of the face. There were no significant changes in ball flight characteristics between conditions when using the 5-iron. When using the 7-iron, there were significant differences in launch angle, spin rate and total distance between the three conditions. The results provide valuable insight into the practical implications of using face tape to establish strike location and inform recommendations for maintaining data quality during testing.
5-iron interpretation and findings: No statistically significant differences were found between the clean, face tape, and residue conditions for any ball launch variables. Launch angle values remained consistent across the three conditions: clean (13.68 ± 2.06°), face tape (14.59 ± 2.52°), and residue (14.03 ± 1.99°), as did total distance: clean (201.88 ± 22.67 yards), face tape (206.27 ± 23.42 yards), and residue (200.06 ± 21.43 yards). From a practical standpoint, this suggests that residue left on the clubface following the removal of face tape has minimal impact on performance outcomes when using clubs with lower lofts.
These findings contrast with earlier reports that noted reduced friction can sometimes increase spin with mid-to-long irons (Dewhurst, 2015; Lieberman, 2010; R&A & USGA, 2007). Although the spin increase observed in rough conditions may seem counterintuitive, it is well understood within these specific test environments. No such increase was observed in this study across the clean, residue, or face tape conditions. This suggests that adhesive residue does not replicate the mechanical interactions between club and ball seen in grassy lies, particularly at lower spin lofts. It is possible that testing with even lower-lofted clubs, such as a 4-iron or fairway wood, may reveal different results.
Importantly, the consistency of results between the clean and residue conditions reinforces the practical utility of face tape when properly removed. While concerns have been raised in previous literature about unintended effects from altered face conditions (Cochran & Stobbs, 1968; Dewhurst, 2015), the present data indicate that adhesive residue does not significantly affect ball flight in the case of longer irons. This strengthens the argument that face tape can be used reliably in custom fittings to identify strike location without compromising launch monitor data, particularly in the context of 5-iron shots.
7-Iron – Interpretation of findings: With the 7-iron, statistically significant differences in launch angle, spin and total distance were observed across the three face conditions. The performance of the face tape condition, characterised by a substantially higher launch angle, reduced spin, and longer total distance, conforms to what coaches observe within the real world (see Figures 4, 5 and 6 for visual representations). To date, however, this is the first research that has directly investigated this and, as such, serves as a useful reference point. From a theoretical standpoint, a smooth clubface, akin to the face tape condition, would mean that there is reduced tangential force applied to the golf ball (Cochran & Stobbs, 1968). This would therefore result in a launch angle nearer to the applied loft of the clubhead (i.e. a higher launch), which was observed within this investigation.
Turning to the key comparison of interest, clean vs. residue, a statistically significant reduction in spin rate was observed for the residue condition compared to clean (5250.64 vs. 5790.51 RPM, p=0.048) (see Figure 4). This finding aligns with Dewhurst (2015), who highlighted that reduced friction typically leads to lower spin rates, an expected outcome for mid-lofted irons like the 7-iron. Supporting studies, such as Lieberman’s (1990) ball cannon experiments and the R&A/USGA (2007) player testing, further confirm that surface lubrication may influence spin depending on loft and impact conditions.
Despite the significant impact on the spin rate, no significant differences were observed in launch angle for the clean (18.03 ± 2.15°) vs residue (18.94 ± 2.96°) condition or total distance for the clean (168.93 ± 18.75) vs residue (170.81 ± 17.81) condition. Although adhesive residue slightly reduced spin overall, this did not result in meaningful changes to ball flight and reinforces the notion that while minor residue may affect spin to a limited extent, it is unlikely to distort launch monitor data in ways that would mislead coaching or fitting interventions.
An interesting observation during data collection was that initially, higher spin rates were recorded with the residue club compared to the clean condition (6062.5 RPM vs. 5548.4 RPM) across the first six participants. From the seventh participant onward, this trend reversed, with the clean club averaging 5878.8 RPM and the residue club dropping to 4902.7 RPM, observed in 86.7% of remaining participants (see Figure 4). This may suggest that early residue accumulation temporarily increased surface friction, causing the ball to ‘stick’ and spin more. Over time, however, the residue may have evolved over time and clogged the grooves, or become harder as it dried, smoothing the face and reducing spin potential. Although anecdotal, the data indicates that a buildup of residue may evolve over the course of a session, underscoring the practical importance of cleaning the clubface during extended use. It is also plausible that the switch in greater spin rate could have purely occurred by chance (as there was not a gradual change in the emphasis). Nevertheless, this is still of interest as it would indicate that spin outcome is very much individual and dependent on the delivery of the club to the ball. The data also highlights the need for further investigations into the long-term accumulation of residue and its interaction with groove geometry and ball type. Future research could also explore whether repeated impacts under residue conditions eventually shift performance outcomes.
Variability in spin generation also remains a key consideration for coaches and custom fitters. In this investigation the CV% exceeded the commonly accepted threshold of 10% for each of the face conditions (clean, CV = 12.9%, residue, CV = 14.3% and face tape, CV = 30.8%). This suggests that spin outcomes are less consistent given no substantial changes in the impact variables. Previous research has highlighted spin generation is subject to considerable noise (Brennan et al., 2024; CV = 22.19%, 95% CI = 17.02% – 28.81%), likely due to its sensitivity to a wide range of factors, including club head speed, angle of attack, dynamic loft, and impact location (Betzler et al., 2014). In this context, the current findings reinforce the idea that spin is particularly susceptible to intra-subject variability. Thus, PGA Professionals, custom fitters and researchers should interpret spin data cautiously and consider this inherent variability when evaluating ball flight characteristics within fitting or performance analysis contexts.
It is important to recognise the limitations with this investigation. Firstly, the ball flight data attained from this investigation is reflective of the range balls used and not premium balls that a player would typically use on the course. However, the use of range balls is ecologically valid as this is representative of what a PGA Professional would do within a range based fitting session. A further limitation could be considered around the nature of the testing for the residue condition. Specifically, after each participant the residue wasn’t cleaned off, meaning that the condition may have changed slightly. However, this approach is ecologically valid in that it is representative of what can occur in a coaching environment. Further research may wish to control each of the residue conditions by cleaning and re-applying residue to the clubface.
Practical Considerations for Coaches and Club Fitters
The findings from this study support the recommendation that data should be collected with clean clubfaces, as this provides the most consistent and reliable information for coaches and custom fitters when using launch monitor technology. While the presence of face tape residue did not lead to major changes in ball flight, especially for longer irons, there were small but notable effects on spin with the 7-iron. As such, PGA Professionals and club fitters should be cautious when interpreting launch monitor data if face tape or residue is present on the clubface. This caution is particularly important when relying on narrow performance metrics such as spin rate, which can be highly sensitive to subtle changes in face conditions, the delivery of the club into impact, and variations in impact location. In these instances, even minor residue can introduce variability that may not meaningfully impact performance but could mislead decision-making. To mitigate this risk, practitioners are advised to adopt a holistic approach to interpreting launch data, considering strike pattern, ball flight, and player feedback alongside numerical metrics, and to clean the clubface regularly throughout fitting or coaching sessions.
Notably, this investigation also observed considerable intra-participant and inter-participant variability in spin rates across identical face conditions. Some players recorded differences exceeding 1500 RPM between shots, even when other parameters such as launch angle and ball speed remained consistent. This highlights how individual delivery patterns and small variations in strike can introduce more variability than minor changes to clubface condition alone, reinforcing the need for contextual interpretation of spin data during performance analysis.