1. Introduction
Research investigating and reviewing performance variables in golf have been conducted on the Ladies’ (Chae et al., 2018) and Men’s (Baugher et al., 2016; Hellström, 2009; Moy & Liaw, 1998; Wiseman & Chatterjee, 2006) Professional Golfers’ Tour (PGA) in America. However, by comparison, the European Tour has received scant attention, with the last attempt to model performance using playing statistics conducted in 2001 (Ketzscher & Ringrose, 2002). It is well known that golf has changed drastically in the 20 years since that study. For example, Heiny (2008) demonstrated that mean drive distance (DD) on the PGA tour increased by 24 yards between 1992 and 2003 (260 to 286 yards, respectively), with the European Tour mean DD increasing from 267 to 280 yards between 1998 and 2001 (Ketzscher & Ringrose, 2002). Therefore, as further changes are likely to have occurred since these studies, it is necessary to conduct an updated determinants of performance analysis.
Although performance determinants studies on the PGA Tour in America have been conducted, the European Tour has a number of key differentiators that mean that a bespoke analysis is required. For example, a novelty of the European Tour in comparison to the American PGA Tour is the element of regular intercontinental and inter-country travel. Indeed, the “European” Tour is arguably a misnomer as the tour schedule incorporates significant travel not only within Europe, but also to The Middle-East, Asia, Africa, and Australasia (Bliss, 2018). From a performance perspective, this has serious implications as international travel is known to cause physiological disturbances which can interfere with training and competition preparation (Reilly et al., 2005), further enhancing the requirement for increased understanding of European Tour performance. It is possible that, owing to variations in external factors such as course design, travel, weather, number of players, player performance etc. between PGA and European Tour events, that, even though performance models exist for the PGA Tour (Baugher et al., 2016), these models may not necessarily transfer into successful performance prediction on the European Tour.
Small discrepancies in performance skills can lead to large differences in event outcome, finish position, and monetary earnings. This was demonstrated on the European Tour by Jimenez and Fierro-Hernandez in 1999, showing that performance variables such as DD, greens in regulation (GIR), and sand saves could all statistically differentiate the top 10, and bottom 10 performers on the European Tour (Jiménez & Fierro-Hernández, 1999). Over the course of the season, these small variations in performance ultimately dictate the player’s score, and their finishing position. DD, drive accuracy (DA), and the division of putts per missed green in regulation and putts per GIR were shown to account for between 41-52% of stroke average from 1998-2001 (Ketzscher & Ringrose, 2002). Although not on the European Tour, it has further been demonstrated that players with greater DD score better on par four and five holes (Hellström et al., 2014). Despite the usefulness of these findings, specifically on par four and five holes, no analysis of hole type (par three, four, or five) and performance variables has previously been conducted on the European Tour. Such an analysis would help players and coaches with their strategic performance planning and will help golfers understand which metrics determine performance across hole types, across time. Therefore, to understand which variables predict performance, there were two aims of the study: 1) Compare performance variables to identify changes across the three most recent seasons. 2) Investigate predictors of par three, par four, and par five average score in elite golf at the European Tour level across recent seasons.
2. Methods
2.1 Participants
A total of 249 individual players were included in the study. Data were obtained from the European Tour website (www.europeantour.com accessed 1st December 2019). To be included in the study, players must have completed at least 30 rounds (the minimum number to be recorded on the Tour’s website) on the European Tour in the corresponding season being analysed and were required to have a complete data set across all dependent and independent variables outlined below. The 2017, 2018, and 2019 seasons were chosen as they were the three seasons that had complete data sets available at the time of access and were unaffected by COVID-19. The top ranked 200 players in the European Tour’s Race to Dubai (R2D) classification system in each year were identified for the study as players outside this rank often had incomplete data sets. As these data were publicly available and did not contain any sensitive, personal information, ethical approval was not required. Eighty players had data for all three seasons, 73 played two of three seasons, with 96 having data for a single season. The number of individual players analysed per season were as follows: 2017 n= 151; 2018 n= 165; 2019 n= 161. These were the three seasons that had complete data sets available at the time of access.
2.2 Analysis
All data were downloaded from the European Tour website, stored on an electronic spreadsheet (Excel, v2016, Microsoft, USA) and transferred to a statistical package for further analysis (IBM SPSS Statistics, v24.0, IBM Corporation, USA). 2017, 2018, and 2019 were chosen as they were the three most recent years with comprehensive statistics that were publicly available. Data were assessed for normality using the Kolmogorov-Smirnov test as well as visual inspection of histograms and Q-Q plots. Homogeneity of variance was assessed using Levene’s test. Mixed linear modelling (MLM) was conducted with 2017, 2018, and 2019 as fixed factors, and individual players as random factors. Where significance was observed between fixed factors, Bonferroni post-hoc tests were used for pairwise comparisons.
Stepwise multiple linear regressions were conducted for each season with par three average score, par four average score, and par five average score as the dependent variable. Variables were removed from the regression calculation if they displayed high collinearity, as determined through a variable impact factor (VIF) (whether one predictor in the model has a relationship with another predictor) > 10 or a tolerance (the reciprocal of VIF) of < 0.2 (Field, 2013). The same independent variables were used for the par four and par five regression calculations, these were: DA, which represents the number of fairways hit (%); DD (yards); GIR; scramble %; sand save %; and putts per round. DA was removed for the par three regressions as it was not relevant because of the length of the holes and it was also covered by GIR, but all other independent variables were included. DD was included for the par three analysis as although par three holes will not require a maximum distance tee shot with a driver, longer hitters have higher clubhead speeds and will need to hit “less club” for their approaches to par three holes compared to shorter hitters. An alpha level of p < 0.05 was set for statistical significance with 95% confidence intervals reported. Cohen’s d effect sizes (ES) were calculated with 95% confidence intervals (CI) with the following threshold values: ≥0.2 = small, ≥0.5 = moderate, ≥0.8= large (Cohen, 1977) for MLMs. Cohen’s f2 effect sizes were calculated for multiple regressions with the same thresholds (Cohen, 1977).
3. Results
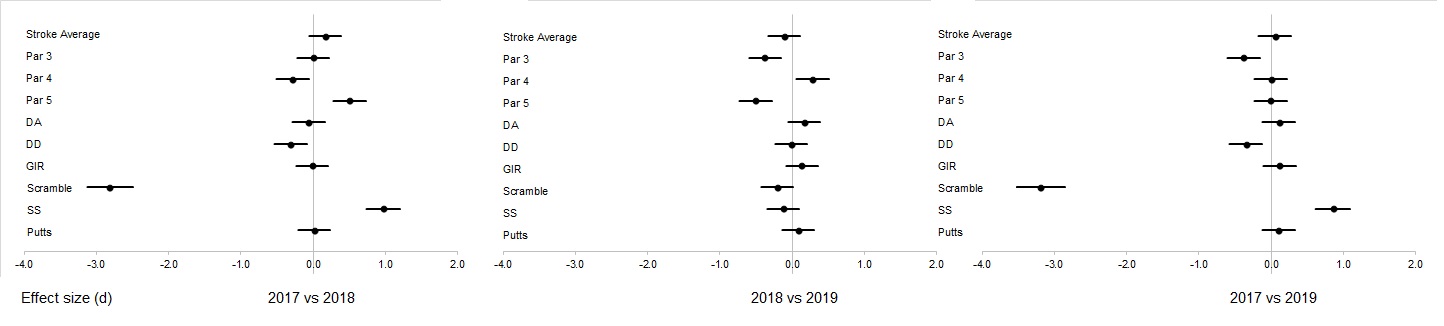
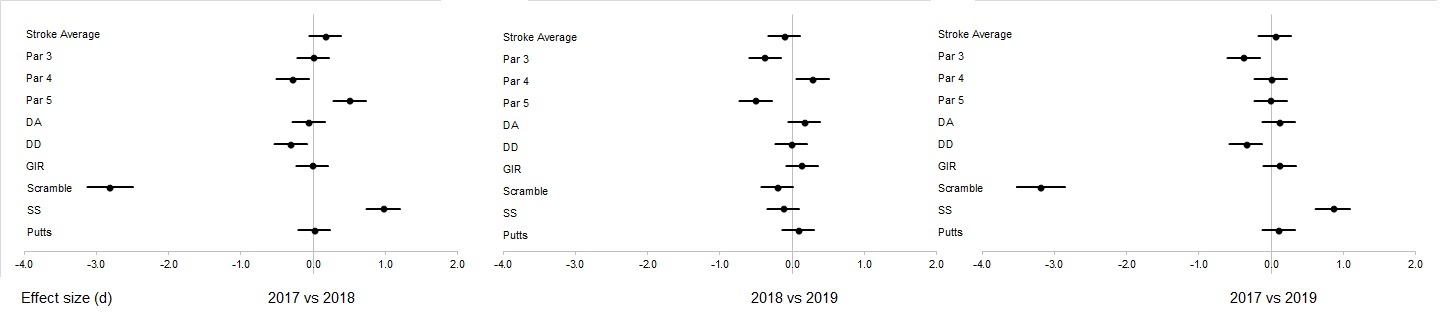
Data from the 2017, 2018, and 2019 seasons and results from the MLM are reported in Table 1. ES are displayed in Figure 1. No statistically significant differences were observed for DA, GIR, or putts per round (p >0.05). Comparing 2017 and 2018 revealed that R2D rank (p <0.01) par four average score (p= 0.01), par five average score (p <0.01), DD (p <0.01) scramble % (p <0.01), and sand save % (p <0.01) all showed significant differences. Effect sizes were small or moderate, except scramble which was large (ES= -3.01) and sand saves % (ES= 1.00). Comparing 2018 and 2019 revealed differences in par three (p= 0.02), four (p= 0.01), and five average score (p <0.01). Effect sizes were all below 0.5. Comparing 2017 and 2019 revealed differences in R2D rank (p= 0.05), par three score (p= 0.02), drive distance (p= 0.01), scramble % (p <0.01), and sand save % (p= 0.01). All effect sizes were within ±1.0, except for scramble %, which was -3.19.
The outcomes from the stepwise multiple regressions are displayed in Table 2.
4. Discussion
This paper aimed to investigate changes in performance across the three most recent seasons on the European Tour and also use multiple linear regression to explain performance on par three, par four, and par five holes. This study is the first to undertake this analysis in elite golfers on the European Tour. The main findings were that mean DD was greater in 2018 and 2019 than 2017. Interestingly, despite this increase in distance, DA showed no difference across all years. 2019 also had better par four average scores than 2018. 2017 had the greatest par three average score and sand save % of all years, but scramble % was greater in 2018 and 2019. Interestingly, despite these differences, stroke average, GIR, and putts per round showed no change in any of the three seasons studied.
The other main findings from this study are that 36-57% of a player’s average par three score can be explained by regression modelling of performance variables available on the European Tour website and explained 77-81% of par 4 and 56-68% of par 5 holes, respectively. Average par three scores could be least explained using regression modelling, with par four average score having the highest explanatory outcomes. GIR and putts per round entered all nine of the predictive models, DD entered seven, DA entered four, and scramble % two. Sand save % did not feature as an explanatory variable in any model.
A key finding from this research when comparing performance variables across years was that DD was greater in 2018 and 2019 than 2017. In 2019 average DD was 295 yards. Although contextual factors such as courses played and environmental conditions may explain some of this change, average DD of 295 yards is nine yards further than the average DD in 2003 and 45 yards further than 1992 when compared to the PGA tour (Heiny, 2008), and is 22 yards further than the top 10 players from the 1998 European Tour (Jiménez & Fierro-Hernández, 1999). However, despite these increases, DA did not change throughout the three seasons analysed here. DA figures do appear to be lower from 2017-2019 (58-59%) when compared to 1999 (67% top 10 players, 61% bottom 10 players) and are lower than those reported from the PGA Tour (64-65%) in 2009. A likely explanation, in part, for the difference in comparison to the PGA Tour is that the work of Hellström and colleagues (2014) focused on the top 125 players of that season, whereas the players here were from the top 200. It is probable that players lower on the overall rankings would perform at a lower level across a number of metrics, bringing the overall average down. However, the benefit of including their performances is that it provides a broader range for scoring analysis and is more reflective of the majority of the European Tour, rather than just the top performers. Additionally, the cut off point for retention of full European Tour status is usually a finish position of 110-115, although players who finish below this point may retain some playing privileges. Therefore, including players both inside and outside of this threshold provides useful information for players who finish in these positions and for their coaching and support staff. Future research should compare the performance variables of top performers, versus those who finish below the cut off point for retention of playing privileges. This will help to establish a minimum threshold to maintain Tour status. Additionally, a study that assesses the within- and between-player variability across multiple seasons would be of interest as it would allow coaches and players to understand the performance “bandwidth” and how performance changes for players over time.
The linear regressions conducted herein demonstrated that GIR and putts per round were the primary explanatory variables for performance on all hole types. While each regression calculation had multiple variables that entered the respective models, it must also be noted that it is the combination of these variables that account for the model rather than the variables in isolation. As such, coaches and players should consider the combination of the variables in each model if seeking to structure their performance approach. Notwithstanding, GIR and putts per round were in all predictive models, for all hole types across all three seasons. DD was a predictor variable in seven of nine calculations, with DA in four, and Scramble % in three. Sand save % did not enter any predictive model. GIR has long been understood to be a crucial performance determinant in elite golf, with Davidson & Templin (1985) reporting it as the strongest correlate of scoring performance on the PGA Tour as far back as 1983. Using data from around the same time, Jones (1990) demonstrated putts per round was the best predictor of both scoring and monetary earning on the PGA Tour. In 2002 and 2006, using data from 1990 to 2004, regression modelling showed that GIR and putts per round were also the two strongest predictor variables of stroke average on the PGA Tour (Finley & Halsey, 2004; Wiseman & Chatterjee, 2006). It appears that these variables are stable predictors of performance and this also transfers to the European Tour.
DD was a predictor variable in seven of the nine regression models carried out. While this is perhaps to be expected for longer holes, interestingly, DD was a predictor variable for par three holes in all years investigated. Although DD will not be a direct predictor on par three holes owing to hole distance being too short to maximise a full drive, it is probable that longer drivers will generate higher clubhead speeds and will, consequently, be able to hit “shorter” clubs and have increased control over ball flight with these shorter and more lofted clubs for their approaches. It has been demonstrated on the PGA Tour that as distance to the hole for approach shots increases, so does error, with players missing more greens playing approaches from over 200 yards, when compared to 100 to 200 yards (James & Rees, 2008). Therefore, players who have greater DD also perform well on par three holes, probably owing to their higher clubhead speeds and having to hit “less” club to a par three hole in comparison to shorter drivers.
Scramble % also appears to be an important performance determinant on the European Tour as it entered three predictive models. Additionally, scramble % showed a large increase from 2017 to 2018 and was maintained in 2019. Again, this appears comparable to recent findings from the PGA Tour where on par four and par five holes, driving further and having the ball closer to the green for approach shots, even if off the fairway, was desirable for reducing hole score (Hellström et al., 2014). If players can score more effectively from closer to the green, even if off the fairway, then the ability to scramble becomes an important characteristic of the golfer’s performance make-up and it appears that this is also the case for the European Tour, although not for each year observed. Scramble % entered models in 2017 and 2019 but not for any model in 2018. While this difference cannot be conclusively explained, it may have been a result of contextual factors in that season such as course set up and variety.
Lastly, despite the changes presented in this paper across seasons, stroke average, a widely accepted critical performance variable for golf performance, has remained unchanged from 2017 to 2019 inclusive. One possible explanation for this is that, in this study, the mean overall rank of the players included for analysis was lower (if a rank of 1 is considered the highest) in 2018 and 2019 when compared to 2017. Stroke average was lowest in 2018 but did not achieve significance. However, more players were included in 2018 and 2019, which probably represents an increase in the volume of data collected by the European Tour. Although it would have been possible to exclude more lowly ranked players to achieve no difference across years, it was felt that including all players who met the inclusion criteria was beneficial as it provides a more holistic representation of the playing field. It is also probable that as the courses played on the European Tour (and the subsequent pars on those courses) change across seasons, that any change to stroke average may be lost in these contextual differences.
5. Conclusion
Studies of golf performance across time on the European Tour are scarce. Additionally, modelling using performance variables in golf has been undertaken at the elite level for many years, but the predominance of this work has been conducted on the PGA Tour. The present study shows that from 2017 to 2019, DD increased, while DA remained unchanged. Scramble % also showed a large increase in 2018 and 2019 when compared to 2017. On the European Tour, in conjunction with the other measured variables, GIR and putts per round are stable, consistent performance predictors, as well as DD. DA and scramble % also help to explain performance as where sand save % does not. These predictive models could explain a large proportion of hole performance. For example, GIR, putts per round, and DA could explain up to 81% of performance on par four holes in the 2018 season. Par three holes are more difficult to predict. Players and coaches on the European Tour may benefit from this analysis as it highlights the key variables which underpin and explain golf performance at the elite level.
Disclosure of Interest
The author discloses no competing interests.
Acknowledgements
None