

Introduction
Golf is a dynamic sport with constant variability and an infinite number of factors influencing every shot and swing (Betzler et al., 2012; Horan et al., 2011; Langdown et al., 2012). A player, consciously or subconsciously, is utilizing information during the golf swing about the environment, the shot at hand, and the swing that’s for a given shot. From intrinsic feelings and thoughts to what constraints and opportunities the environment affords, key pieces of information help the golfer determine what shot to hit, what the golfer should “feel” throughout the swing, and what adjustments need to be made during the golf swing through impact. Attentional focuses during sports, and more specifically the golf swing, have been previously analyzed where various tasks and skill levels impact what an athlete utilizes to perform the sport movement (Fontani et al., 2006; Perkins-Ceccato et al., 2003). Attempting to lower golf scores, differences have been explored between various handicap levels to develop strategies in improving performance on the course (Abernethy & Neal, 2010; Cheetham et al., 2008; Fuyu et al., 2019; Sell et al., 2007; Whitehead et al., 2016). While differences exist in how a player performs the golf swing, some studies highlight specific characteristics which may reflect an “ideal” swing (Morrison et al., 2016, 2018; Zheng et al., 2008). Furthermore, previous research has discussed the role of movement variability where there can’t be an “ideal” swing with every swing being different (Abernethy & Neal, 2010; Langdown et al., 2012; Morrison et al., 2016; Tucker et al., 2013). Coupling the complexity of the golf swing and the manipulation of an infinite number of variables, constant “ideal” characteristics of the golf swing and movement variability may both play roles in helping golfers perform the task. However, a consistent conclusion has been derived where “feel” does play a role for golfers during the golf swing (Carello et al., 1999; Montero, 2010; Perkins-Ceccato et al., 2003; Roberts et al., 2001, 2005a, 2005b). Without being clearly defined in previous literature, the “feel” of the golf shot will be defined as the golfer’s perceptions through the entirety of the swing based on sensory body awareness, club characteristics, and clubface characteristics at impact. Other factors may be associated with what a player feels such as visual or auditory feedback, but they are the results of the swing and impact characteristics. Discrepancies between skill levels, and more specifically, the role of “feel” across skill levels will be explored to highlight factors various handicaps utilize to perform the golf swing.
Factors that distinguish low handicap players from high handicap players have been examined previously (Abernethy & Neal, 2010; Betzler et al., 2012, 2014; Callaway et al., 2012; Cheetham et al., 2008; Fedorcik et al., 2012; Fuyu et al., 2019; Kim & So, 2017; Langdown et al., 2012, 2013; Lindsay et al., 2008; Sell et al., 2007; Zheng et al., 2008). The psychological, attentional, and perceptual skills golfers use has been analyzed (Roberts et al., 2001, 2005a, 2005b; Singer et al., 1993; Swann et al., 2016; Thomas & Fogarty, 1997). Additionally, psychological, attentional, and perceptual differences have all been investigated between elite athletes compared to lower-level athletes (Carello et al., 1999; Fontani et al., 2006; Montero, 2010; Morrison et al., 2016; Perkins-Ceccato et al., 2003; Sanchez-Lopez et al., 2014; Whitehead et al., 2016). These differences compare how an athlete performs an action. Singer’s et al. (1993) study and Swann’s et al., (2016) study examined two different psychological states used to learn and perform; letting it happen and make it happen, where the “it” refers to the sport movement to complete a task. Letting it happen is associated with open-ended goals, desiring athletes to reach “flow” states, and ultimately achieving greater confidence. Letting it happen could be not having a specific score to shoot in a round or not focusing on a technical aspect of a swing. The player can let their swing happen, hit a great shot, build confidence and momentum, and the player achieves a “flow” state where they’re in the zone. Making it happen incorporates more close-ended goals, requires strong intensity and concentration where heightened awareness is needed to be successful. Making it happen focuses on specifics such as needing a certain score to win a tournament and success is achieved if the goal was met (Swann et al., 2016, pp. 28–29). Arguments for both support various ideas for learning and performing movements. As seen in prior literature, nature of the task, skill level of the athletes, and the individual needs of the performer can impact the appropriate course of action for learning and performing (Adlington, 1996; Fontani et al., 2006; Newton, 2007).
Additionally, attentional states may change depending on when during the process of planning and performing a shot an elite golfer exhibits cognitive processing. As proposed by two studies researching the differences between golfers’ cognitive processing at various skill levels, conclusions may not be that elite golfers have fewer swing thoughts or exhibit more cognitive control (Fontani et al., 2006; Perkins-Ceccato et al., 2003). The timing of thoughts, whether they are before or during the golf swing, might be different for skill levels. Elite athletes have shown to consciously consider more variables before the shot, where their swing thoughts are more in depth and of greater magnitude (Perkins-Ceccato et al., 2003; Sanchez-Lopez et al., 2014; Whitehead et al., 2016). Elite players who focus on using the information they’ve gathered and using their “feel” factor during the shot had results of smaller variable error compared to using internal instructions (Perkins-Ceccato et al., 2003; Sanchez-Lopez et al., 2014). In contrast, golfers at lower skill levels had smaller variable error during their swing when they used internal instructions compared to external instructions (Perkins-Ceccato et al., 2003). The role of “feel” during a shot is impacted by skill level. While “feel” is a subjective measurement, various metrics have attempted to quantify “feel” to explain the role it has during the golf swing.
Measurements quantifying swing kinetics, swing kinematic data, and shot outcome data have been found to provide information on why elite golfers perform superiorly to higher handicaps (Cheetham et al., 2008; Fedorcik et al., 2012; Kim & So, 2017; Langdown et al., 2012, 2013; Lindsay et al., 2008; Zheng et al., 2008). This includes analyzing what is known as the “gear effect” where the impact location in reference to the club’s center of gravity alters the clubface direction. The “gear effect” contributes to how players may interpret their feel during shots, specifically with evaluating internal vibrotactile sensations as seen in Roberts & colleagues 2005 study (Roberts et al., 2005b). With many technical aspects in the golf swing, impact location has been investigated to understand the relationship between the clubface and golf ball when players make contact during swings not only in golf, but other rotational sports involving players swinging an object to hit a ball (Betzler et al., 2012, 2014; Fuyu et al., 2019; Peploe et al., 2018). Allowing players access to quantitative data gives numerical and visual feedback to describe different thoughts and feelings during shots (Roberts et al., 2001). Players can utilize quantitative data in numerous ways to assist in describing or estimating the shot outcome metrics. Although quantitative data has been analyzed to describe differences between skill levels, research has yet to explore estimated measures from the player based on the “feel” during shots (Betzler et al., 2012; Ellis et al., 2010). Furthermore, the relationship between how accurately players can estimate measurements on the outcome of shots and the skill levels of golfers has yet to be analyzed.
Therefore, the purpose of this study was to analyze the relationship between player’s handicaps and the accuracy of estimations on impact location and shot outcome characteristics. More precisely, can higher skilled golfers estimate where they hit the ball on the clubface and what occurred during approach shots better than golfers at lower levels? Data gathered could assist coaches and players in understanding what allows certain golfers to perform better. Practice techniques such as attempting to vary the impact location or alter swing characteristics affords players opportunities to hit certain shots based on the situation or environment such as needing to draw the golf ball around a tree. Pursuing center of the clubface impact location and consistent swing characteristics may be appropriate to succeed, but the reality of shot variability does not allow the same shot and outcome features. It was hypothesized that highly skilled golfers would be able to estimate more accurately to the measured values for impact location, carry distance, and the offline of target direction than lower skilled golfers.
Methods
Experimental Approach to the Problem
A descriptive research design was used to compare various skill levels of players based on handicap with the difference in estimated versus actual measured values in horizontal component impact location, vertical component impact location, carry distance, and direction offline of target line. All measurements were taken immediately after shot completion.
Participants
49 healthy golfers volunteered to be part of the study. Subject requirements included no current injuries, actively golfing during the season, and a handicap below 35. Each participant’s data was analyzed separately and categorized into five handicap groups for the purpose of keeping similar skill levels together. The five handicap groups were less than 3, 3 to 6.99, 7 to 12.99, 13 to 17.99, and 18+. 10 golfers were in each handicap group for standardization purposes with the one exception being the less than 3 handicap which had 9 participants. The final 5 participants were recruited to regulate the number of participants in each handicap group. The study was reviewed and ethically approved by Interlachen Country Club’s Board of Directors.
Instrumentation
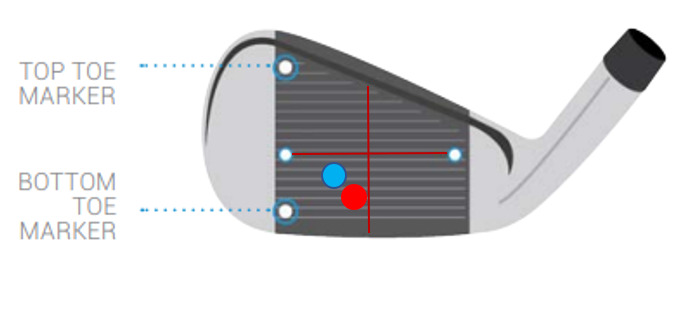
All subjects completed experimentation in the Golf Learning Center, an indoor facility, at Interlachen Country Club in Edina, MN. Each subject completed twenty 7-iron shots. Generally regarded as the “standard” club in the bag with typical shaft length and loft measures as the average club in a player’s bag, 7-iron was considered the “standardized” club to utilize. Potential differences could be found if other clubs were used in place of a 7-iron. With a shorter or longer shaft, potentially a different shaft material, and different clubhead characteristics, for instance a driver, variations in a players feel may or may not vary, so 7-iron was chosen to keep the equipment used consistent. Measured data was gathered using a Foresight Sports GCQuad (GCQuad) along with 4 reflective dot markers for each club. Participants were not allowed to view any shots taken, including warm up shots. Visual feedback was not given for any shots with the projector turned off, a blinder being used to cover up the computer monitor, and tape strips covering the GCQuad screen. Using the constructed blind, limitations on any visual feedback was minimized. In a previous study done by Leach et al. (2017), the authors caution the use of a Foresight Sports GC2+HMT or Trackman to report club parameters due to the variability seen in measurements. Additionally, the authors discuss a potential cause for the club parameter variation using Foresight by the “lack of target-line alignment.” However, attempts to mitigate target-line alignment issues were taken utilizing an indoor plastic tee and placing it on the ground against the projected screen to represent where the straight target line would be if it was visually represented. The plastic tee was aligned before each participant hit and was recalculated if the tee moved during any trials. With minimal prior research on the validity of impact location measurements using various launch monitors, the GCQuad was chosen as the launch monitor due to accessibility and the procedures for reporting clubhead parameters compared to Trackman. While Trackman utilizes algorithms and equations to calculate shot metrics, Foresight Sports uses pre and post impact images to report shot and clubhead parameters (Leach et al., 2017). The Foresight Sports GCQuad was found to be an acceptable and possibly more acceptable launch monitor than the GC2+HMT used in Leach’s study due to the GCQuad having two additional cameras to measure clubhead parameters. Reflective dot markers were placed on the clubface each session according to Foresight Sports directions outlining the Center of Gravity (Foresight Sports, 2013). Figure 1 displays the clubface setup with three dots placed towards the toe of the clubhead; one dot was placed in between the bottom two grooves (“bottom toe marker”), another was placed in between the grooves representing where the Center of Gravity was measured, and the third dot was placed in between the top two grooves (“top toe marker”). The fourth reflective dot marker was towards the heel of the clubhead, but in line with the second dot placed on the clubface.

Each subject used his or her own 7-iron to eliminate the use of an unfamiliar club with hitting and swinging. This allowed each participant to feel 7-iron shots they would normally hit on the course with a familiar club. Each subject provided their current average carry distance on the course. Clarification on carry distance was offered to each participant to minimize limitations on participants accidently providing total distance including roll instead of only carry distance. Three standardized clubheads were used for the horizontal and vertical component estimations. Standardized clubheads were used to eliminate any visual bias of golf ball dimple residue marks the subject could utilize to estimate the impact location after their shot. PXG models 0311 XF, 0311 P, and 0311 T of the Forged Generation 2 series were used as the standardized clubheads which allowed clubhead options on the player’s iron-to-game improvement iron spectrum. A standardized clubhead was chosen to resemble each subject’s 7 iron. An x-axis and y-axis were drawn on each standardized clubhead. The intersection of the x-axis and y-axis was deemed to be the Center of Gravity or “sweet spot” of the clubface. The x-axis started from the middle reflective dot towards the toe to the reflective dot towards the heel of the clubface. The y-axis was the middle point between the two dots that created the x-axis, and a line was drawn perpendicular to the x-axis to represent the y-axis. The middle point was measured to be 2.25 centimeters from both x-axis reflective dots. Figure 1 from Foresight Sports displays how the dots were placed on the subject’s 7-iron, as well as on the standardized 7-iron clubheads with the x and y coordinate grid (Foresight Sports, 2013).
Experimental Procedures
Each participant was able to warm up prior to data collection. Most subjects utilized stretching techniques along with practice shots using his or her own 7-iron off artificial turf without any visual feedback. Once the subject expressed a readiness to start, trials then began.
Participants were walked through the procedure for gathering their estimated horizontal and vertical component measurements from the chosen standardized clubhead. Immediately after each completed shot, the subject was given a pencil and the standardized clubhead to draw a dot on the clubface to estimate the impact location of the shot. Then, the dot on the standardized clubhead was measured using a small tape measure to quantify how many millimeters from the Center of Gravity in the horizontal and vertical directions on the coordinate grid of each subject’s estimated impact location.
Thereafter, each participant was asked a series of questions as to what happened during the shot and the participant’s estimated shot results. Questions included the following:
-
Rate your estimate as to the contact of the shot on a Likert scale from 1-5, 1 being terrible, 5 being perfect or really close to perfect.
-
Did anything go wrong with the shot, and if so, what do you feel went wrong?
-
How far do you believe the ball carried?
-
Do you estimate the ball’s end position was left, right, or on-line with the target line? If left or right, how far do you believe from the target line the ball finished after it stopped rolling?
-
Based on your previous shot(s), what adjustments, if any, are you going to make for the upcoming shot(s)?
Answers to these questions gave quantitative and qualitative data indicating how each participant felt about each shot. Questions 1, 2, and 5 were used as qualitative measures offering further context to the experimenters about how each shot felt for the individual participants. Visual feedback was only provided for the experimenters on the computer monitor behind the blind to ensure shots were completed and recorded on the GCQuad. Encouragement was provided to each subject throughout the trials without feedback as to the accuracy of the participant’s estimations. 20 trials were completed with each participant. If the GCQuad did not pick up the impact location, or if the trial was deemed to be insufficient due to the contact and outcome of the shot, the trial was thrown out and the participant performed an additional shot until 20 trials of data were collected.
Data Analysis
Estimated and measured data were collected and analyzed regarding horizontal component impact location, vertical component impact location, carry distance, and target line displacement after the completion of the trials. Difference values were calculated by subtracting the estimated values from the measured values. Displacement values were then calculated by taking the absolute value of the difference values. Average and standard deviation values on the four data measurements were computed for every participant. The magnitude of the difference and displacement values were used in relation to the golfer’s handicap to describe any relationships or variations seen in the data.
Estimated Horizontal Component Impact Location
With the x-axis from the middle reflective dot toward the toe, to the reflective dot toward the heel of the clubface, the estimated horizontal component was measured by how many millimeters the participant’s dot was drawn from the y-axis. The measurement was taken from the center point of the dot to the line of the y-axis. Any measurement toward the toe of the club or on the left side of the x-axis was considered a negative number for the purpose of the difference measurement. Any measurement toward the heel of the club or on the right side of the x-axis was considered a positive number for the purpose of the difference measurement.
Measured Horizontal Component Impact Location
The measured horizontal component from the GCQuad took the distance in millimeters from the impact location to the y-axis. Foresight Sports categorizes the value as a certain number of millimeters toward the toe or heel (2013). As used for the estimated horizontal component measurement, any measurement categorized as a toe hit was a negative value, and any measurement categorized as a heel hit was a positive value.
Estimated Vertical Component Impact Location
With the y-axis measured to be 2.25 centimeters from both middle x-axis reflective dots, the estimated vertical component was measured by how many millimeters the participant’s dot was drawn from the x-axis. The measurement was taken from the center point of the dot to the line of the x-axis. Any measurement toward the bottom of the clubface or below the x-axis was considered a negative number for the purpose of the difference measurement. Any measurement toward the top of the clubface or above the x-axis was considered a positive number for the purpose of the difference measurement.
Measured Vertical Component Impact Location
The measured vertical component from the GCQuad took the distance in millimeters from the impact location to the x-axis. Foresight Sports categorizes the value as a certain number of millimeters toward the top or bottom of the clubface (2013). As used for the estimated horizontal component measurement, any measurement categorized as a low hit was a negative value, and any measurement categorized as a high hit was a positive value. Values were rounded to the nearest tenth of a millimeter.
Estimated Carry Distance
Participants estimated how far each shot carried based on their normal carry distance and how the trial shot felt. Participants were reminded to provide the carry distance and not the total distance including roll after the ball hit the ground.
Measured Carry Distance
Foresight Sports calculates the carry distance to the nearest tenth of a yard (2013).
Estimated Direction Offline of the Target Line
Participants estimated how far left or right of the target line the shot finished after the ball stopped moving, including the roll after the shot landed. Estimations were provided in yards. All estimations to the left of the target line were considered negative values for the purpose of the difference measurement. All estimations to the right of the target line were considered positive for the purpose of the difference measurement.
Measured Direction Offline of the Target line
Foresight Sports measured direction offline of the target line based on the end position ball distance left or right from the target line and rounded to the nearest tenth yard (2013). The shape of the shot was not being analyzed, but it could have contributed to which direction the ball landed relative to the target line. Measurements were listed as the number of yards offline, and it included the direction of the end position of the ball relative to the target line. As used for the estimated direction offline from the target line, concluded ball positions left of the target line were considered negative values for the purpose of the difference measurement. Additionally, any shot ending right of the target line were considered positive for the purpose of the difference measurement.
Difference Measurements for the Dependent Variables
The difference measurements took the measured value and subtracted the estimated value.
Displacement Measurements for the Dependent Variables
The displacement measurements examined the calculated difference measurements by taking the absolute value of each measurement to determine the magnitude of the difference between measured and estimated values. This allowed further analysis on the disparities between players with different handicaps.
Statistical Analysis
Results are presented as mean +/- SD. Significance was set at P < 0.05. IBM SPSS Statistics 28 Analysis software was used to analyze the data gathered. Means and standard deviations were calculated for the dependent variables using every trial from each subject.
Pearson Correlation coefficient test was used to analyze individual relationships between handicap number and dependent variables. Cohen’s F2 Method of Effect Size was used to calculate effect size for each variable. Power statistics were calculated using Pearson Correlation coefficient tests and were based on Fisher’s z-transformation and normal approximation with bias adjustment. A one-way analysis of variance (ANOVA) was used to compare handicap group means. The F-value in ANOVA was used to examine the variation between sample means within each skill level group. Bonferroni post-hoc comparisons were completed to uncover any differences between the handicap range groups.
Results
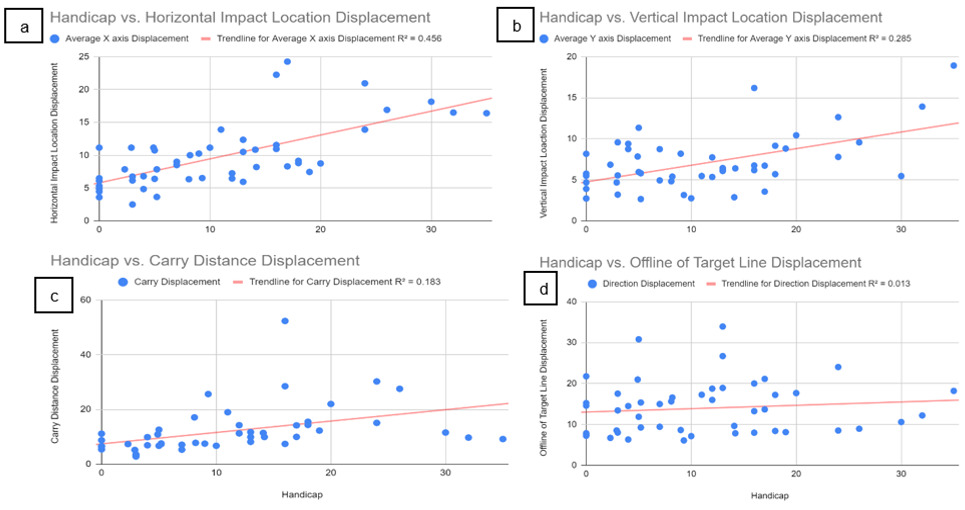
A total of 49 subjects volunteered to participate, 41 males and 8 females, with an average age of 41.25 +/- 17.52 years. The average handicap of the participants was 10.95 +/- 8.99 with handicaps ranging between 0 and 35. All participants completed the 20-shot requirement during the same session and answered with their estimated values immediately after each shot was completed. Data from four variables: horizontal impact location displacement, vertical impact location displacement, carry distance displacement, and offline of target line displacement, were calculated following the conclusion of every subject’s 20-shot trial session. Figure 2 displays each individual’s data point to visually represent relationships with the variables.

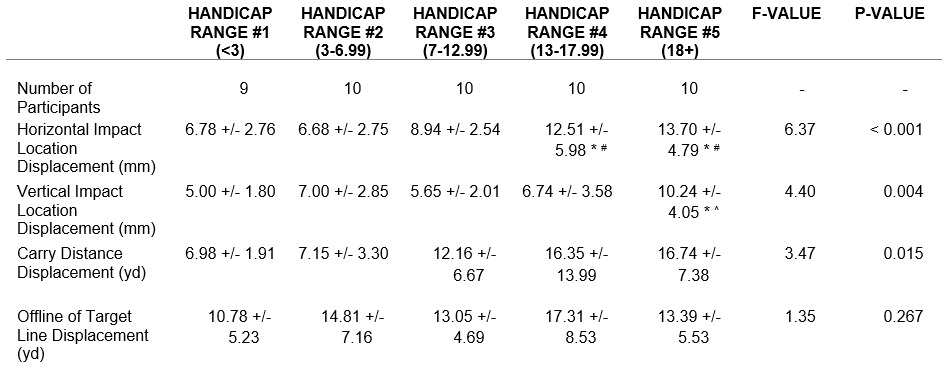
Additionally, after all 49 participants completed their session, handicap ranges were utilized to further analyze data on possible relationships. Subjects were divided into 5 groups dependent on their handicap. The 5 groups included handicaps less than 3, 3 to 6.99, 7 to 12.99, 13 to 17.99, and 18+. Table 2 presents the group data with means and standard deviations of displacement values outlining the relationships seen when certain skill levels were grouped together.
Horizontal Impact Location Displacement
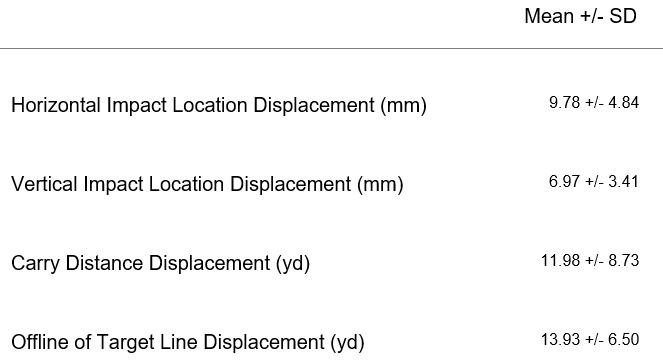
Horizontal Impact Location Displacement mean and standard deviation values are displayed in Table 1. The x-axis displacement value had a significant positive relationship with handicap (r = 0.675, p < 0.001, F2 = 0.837, Power = 1.000). Data points and trendline are shown in Figure 2a.
Vertical Impact Location Displacement
Vertical Impact Location Displacement mean and standard deviation values are displayed in Table 1. The y-axis displacement values had a significant positive relationship with handicap (r = 0.534, p < 0.001, F2 = 0.399, Power = 0.983). Data points and trendline are shown in Figure 2b.
Carry Distance Displacement
Carry Distance Displacement mean and standard deviation values are displayed in Table 1. The carry distance displacement values had a significant positive relationship with handicap (r = 0.428, p = 0.002, F2 = 0.224, Power = 0.880). Data points and trendline are shown in Figure 2c.
Direction Offline of the Target Line Displacement
Offline of Target Line Displacement mean and standard deviation values are displayed in Table 1. The offline of target line displacement values had a positive relationship with handicap (r = 0.114, p = 0.436, F2 = 0.013, Power = 0.123). Data points and trendline are shown in Figure 2d.
Handicap Range Data
The dependent variable’s data utilizing handicap ranges are shown in Table 2 along with ANOVA F-values and P-values. The F-values used in combination with the p-values provided further analysis on whether the overall results were significant or not. No F-values were found to be larger than the F-critical values which didn’t allow rejection of the null hypothesis. However, the F-values extended the context of the overall results, and the p-values gave information on the “big picture” of the results. We observed main-effect differences in horizontal impact location displacement, vertical impact location displacement, and carry distance displacement between handicap groups. Offline of Target Line Displacement did not have any statistically significant results. Further, post-hoc analysis determined horizontal impact location displacement in the 13-17.99 and > 18 handicap groups compared to the < 3 handicap group and compared to the 3-6.99 handicap group were statistically significant differences (p < 0.05). Similarly, post-hoc analysis determined vertical impact location displacement in the > 18 handicap group compared to the < 3 handicap group and compared to the 7-12.99 handicap group were statistically significant differences (p < 0.05).
Discussion
Without any feedback on each golf shot, current golfers attempted to estimate various outcome measurements based on their “feel” during shots. After trials were completed, the actual measured data from each shot was utilized to compare how different handicap players fared with trying to describe what happened during a shot. Relationships were found between skill level and the accuracy of estimation of impact location, which influences ball flight, and the shot outcome metric of carry distance.
The strongest of these relationships were the horizontal and vertical impact location measurements on the clubface. In previous literature, these variables were deemed of great importance to shot outcome metrics with launch characteristics altered based on impact location (Corke et al., 2021). With launch characteristics heavily influencing the outcome of a shot, analyzing the relationship between skill level and the accuracy of impact location estimation was important to examine. Players should know and feel where they need to hit the ball to create desired shot outcomes. Previous findings on shot outcome metrics such as launch angles, distance, spin rates, etc., were affected by impact location (Betzler et al., 2014; Corke et al., 2021). Data from the GCQuad and Foresight Sports further acknowledges what relationships exist with examining ball/shot metrics and clubhead metrics of golf shots (Foresight Sports, 2013).
With significant values at the 0.05 level, Figure 2 displays the relationships between a players’ handicap with the horizontal and vertical impact location. A positive linear relationship between handicap and impact location exists to where highly skilled players may estimate the impact location more precisely than lower skilled players. Furthermore, this is represented in Table 2 when separating players in groups based on handicap. A significant value at the 0.05 level can be seen for horizontal impact location with an F-value of 6.37. While the F-value was not large enough to reject the null hypothesis, the p-value provided a statistically significant value, paired with the findings in Figure 2 with separating each participant, the null hypothesis was rejected for horizontal impact location. With the larger sample size in Figure 2, and the smaller sample size in Table 2 with categorizing handicaps, both display a statistically significant result between handicap and horizontal impact location. However, vertical impact location was found to not have as strong relationship compared to horizontal impact location, but still found statistically significant results with p-values of < 0.001 and 0.004 for Figure 2 and Table 2 respectively. This distinction between the horizontal impact location results and the vertical impact location results was further seen with the Pearson Correlation r-values (0.534 vs. 0.675). An F-value of 4.40 for vertical impact location was not large enough to reject the null hypothesis. However, with the significant p-value of 0.004 at the 0.05 level for the handicap groups and the previous finding with individual participants, the null hypothesis for vertical impact location was rejected. Possible causes for this distinction between horizontal and vertical impact locations could be the y-axis was smaller on the clubface where there was less room for error (Corke et al., 2021). In other words, when participants estimated the impact location of the shot, a greater discrepancy from the estimated to the measured value for the vertical impact location altered the relationship more than the horizontal impact location did. Also, an additional difference between the results from the horizontal and vertical components could have been from the difference in “feel” players had when hitting more towards the toe to the heel for the horizontal component, compared to hitting the ball thin to fat with the vertical component. This relationship could be explored in future studies. Additionally, hitting indoors on artificial turf could have influenced this “feel” since artificial turf is not used on the course where most players typically perform most of their shots during play and practice.
Data on supplemental variables such as carry distance and direction offline of target were also utilized to describe relationships between handicap level and estimation of shot outcomes. Since carry distance and direction offline of target for each shot are the outcome results dependent on the impact location, both of these variables were used to offer further data to support the impact location of each shot (Betzler et al., 2014). Additionally, both variables are often used for each shot a player would hit based on the power and precision a player needs for various shots.
Carry distance was found to have a positive linear relationship with handicap with the r-value of 0.428 and significant result at the 0.05 p-value. Lower handicap golfers may estimate the carry distances of their shots closer to the actual number compared to higher handicap players. The results from Table 2 support the significant result with grouping certain skill levels together with a p-value of 0.015. Although the F-value was not large enough to reject the null hypothesis, the significant p-values for handicap groups and each individual participant led to the rejection of the null hypothesis. Knowing how far a shot carried was valid with highly skilled players performing better compared to lower skilled players. As seen in a previous study, more consistent swings and shot outcomes for higher skilled players allows smaller variations in the performance shot outcomes (Fuyu et al., 2019). A highly skilled player may have an advantage in knowing how far the ball will carry even when the ball may be impacted at various spots on the clubface.
Direction offline of target line was not found to have a strong relationship with handicap. With a low r-value and non-significant result at the 0.05 significance level, a weak relationship was seen as displayed by Figure 2 and Table 2. Without any visual feedback for each shot, participants did not have the confirmation of the shape of the shot and the end position of the shot. Each participant had to solely rely on the “feel” through the shot. This was difficult for many and could factor into why there was not a relationship. As previously stated, a relationship was hypothesized based on lower handicap players having more consistent swings and shot outcomes (Fuyu et al., 2019). However, not having the visual feedback of each shot and the alignment of their stance for the target line was different than what players are used to on the course. Additionally, similar findings regarding inconsistencies in measured direction offline of target line was found in Leach’s et al. study with comparing launch monitors, and more specifically, a Foresight Sports monitor similar to the GCQuad used in the present study. Insufficient and varying results were seen with the Foresight Sports launch monitor with the lack of alignment method for the target line (2017). Using a plastic indoor tee as the target line was vastly different than visualizing and completing a shot on the course. The combination of these factors could affect why the relationship with direction and handicap was not like the other variables being analyzed.
A few limitations were encountered throughout the study. One limitation was the standardization of the equipment used by each subject. With each subject using their own club, standardization of consistent equipment variables was not possible. However, the trade-off for this limitation was each subject using a familiar club and would be able to “feel” shots like they would on the course since they were using their own 7-iron. Additionally, a factor with the standardization limitation was the PXG clubhead along with each participant’s 7-iron and the clubface showing impact location on the GCQuad. Measurements for the face of the PXG clubheads and each 7-iron compared to the clubface on the GCQuad were not the same lengths, so some error may have been present with the magnitude of where the impact locations for the shots were horizontally and vertically on the clubface. Finally, with manually measuring the estimated impact location from each participant, some error could be attributed to inconsistencies in measuring and rounding to the nearest millimeter since the exact lengths were hard for the human eye to see. However, the same practitioner measured and administered every session and shot to keep reliability constant throughout all trials.
Future studies could assess different variables associated with shot outcomes. Foresight Sports offers a wide variety of variables to consider (2013). These measures could additionally be used to discover relationships other than skill levels such as certain characteristics of different swings. Future studies could use age as an important variable to discover relationships. Since a wide variety of ages play golf, age can be an important factor in the quality of shots hit, as well as how a player “feels” or perceives what occurred during a shot. Additionally, other clubs in the bag could be analyzed such as a driver or wedge, similar to what was done in Leach and colleagues’ study in 2017 (Leach et al., 2017). Various clubs carry connotations associated with “feel” such as “needing to have control over your wedges,” or the importance of distance and speed over “feel” and accuracy for a driver. Further discussion points could be explored to describe differences seen between clubs.
Conclusion
The results from this study further indicates differences seen between skill levels of golfers. For golf specifically, the pieces of information, perceptions, and the “feel” golfers have before, during, and after shots can be important tools to improve performance. Low handicap participants were better able to estimate where on the clubface they hit each shot which may associate with how players estimate what occurred during a shot. With the possible overall goal for each golfer to hit a centered strike on every shot, knowing where the ball was hit on the clubface and why it was hit there cannot be an underestimated aspect to optimize performance out on the course.