


Introduction
Results from USPGA golf tour putting data analysis show that a typical PGA tour golfer attempts 29 putts over 18 holes whilst a 90-golfer (player with an average score of 90) attempts an average of 33 putts. The one-putt probability of 50% for a tour pro is 2.4m (8 feet) whilst for a 90-golfer it is 1.5m (5 feet) (Broadie, 2014). This shows that short putting ability is an important factor in determining a score and that this skill requires extremely fine distance and direction control. Pelz & Mastroni (2004) used a specialized True Roller to roll balls from a distance of 3.6m from the edge of the cup and scientifically verified that the highest chance of putting the ball in the cup was when the ball was rolled at a strength that would bring it to a stop 43cm behind the back edge of the cup (Pelz & Mastroni, 2004). However, this experiment used a machine to propel the ball rather than an actual golf putt by a human. More recent studies have focused on body movement function and movement analysis in putting using human subjects (Hasegawa et al., 2013, 2016; Richardson et al., 2018).
Hasegawa et al (2013) carried out an experiment in which the 23 competitive amateur golfers broken into a high anxiety group and low anxiety group performed a cup-in putting task from 1.25m, 1.5m, and 1.75m in both under pressure and no pressure conditions (Hasegawa et al., 2013). In that study they concluded that club head velocity significantly decreased in the high anxiety group when attempting to cup-in from a distance of 1.25m in the high-pressure condition. This study showed that for golfers with long playing careers, level of difficulty of a putt actually increases as the distance decreases, even for distances within 2 meters. Many studies have also used a cup-in putting task to evaluate the number of golf putts or rate of successful putts (Brad & Jonathan, 2014; Mackenzie et al., 2011; MacKenzie & MacInnis, 2017). Other studies have been carried out using a target task where putting performance is judged by distance from the center of the target (Coelho et al., 2012; Lee et al., 2008; Sim & Kim, 2010; H. Tanaka & Iwami, 2018; Y. Tanaka & Sekiya, 2010). In these studies it has been reported that PG attained a significantly closer distance to the target than NG.
The “Yips” is a term commonly used in golf to describe succumbing to pressure related to making a short putt. The reason for the “Yips” has been investigated medically and psychologically (Smith et al., 2003). It has been reported that putting from the non-dominant stance is effective in preventing the reoccurrence of the “Yips” (McDaniel et al., 1989). On tours worldwide, PG prone to the “Yips” have been observed on the green putting from the non-dominant stance in order to prevent the reoccurrence of the “Yips”. However, the proportion of missed putts from a short distance in PG and a comparison with NG, as well as a comparison with putts from the non-dominant stance has not been scientifically reported in previous studies. It is understood that PG have a high level of lengthways putting control from their dominant stance due to many years of training and experience, but it is not known if this is also apparent from the non-dominant stance. There is also a lack of research on putting using a target task to determine lengthways control characteristics. Rather, the majority of research has solely been in regard to directional error (Karlsen et al., 2008; Shim et al., 2012; Van Lier et al., 2011; van Lier et al., 2011).
Therefore, in order to compare short putting ability in both the dominant and non-dominant stance in NG and PG we carried out a putting test 4 times in one week. Our goal was to evaluate the detailed outcome of fundamental putting data from differing stances through analysis of stroke distance error. This data includes whether PG have the ability to stop the ball in a closer proximity to a target from their non-dominant putting stance than NG. This study is further designed to investigate whether short term putting practice could transfer putting skill from the dominant putting stance to the non-dominant stance in PG as well as NG. We designed this study to clarify the questions above by using a task to stop the ball on a putting target from a fixed short distance.
Methods
Participants
Participants were 11 collegiate students (NG) who had no experience in playing a round of golf and 9 professional golfers (PG) belonging to the Professional Golfers Association of Japan, and Japan Golf Tour Organization. The average age of NG was 22.5 ± 1.5 (years), height was 1.68 ± 5.7 (m), and mass was 69.1 ± 9.8 (kg). The average age of PG was 36.0 ± 7.5 years, height was 1.72 ± 6.6 (m), and mass was 76.5 ± 10.0 (kg). All participants were right handed players. A signed informed consent form with the Declaration of Helsinki was attained by the internal committee of the International Budo University before testing.
Experimental Set Up
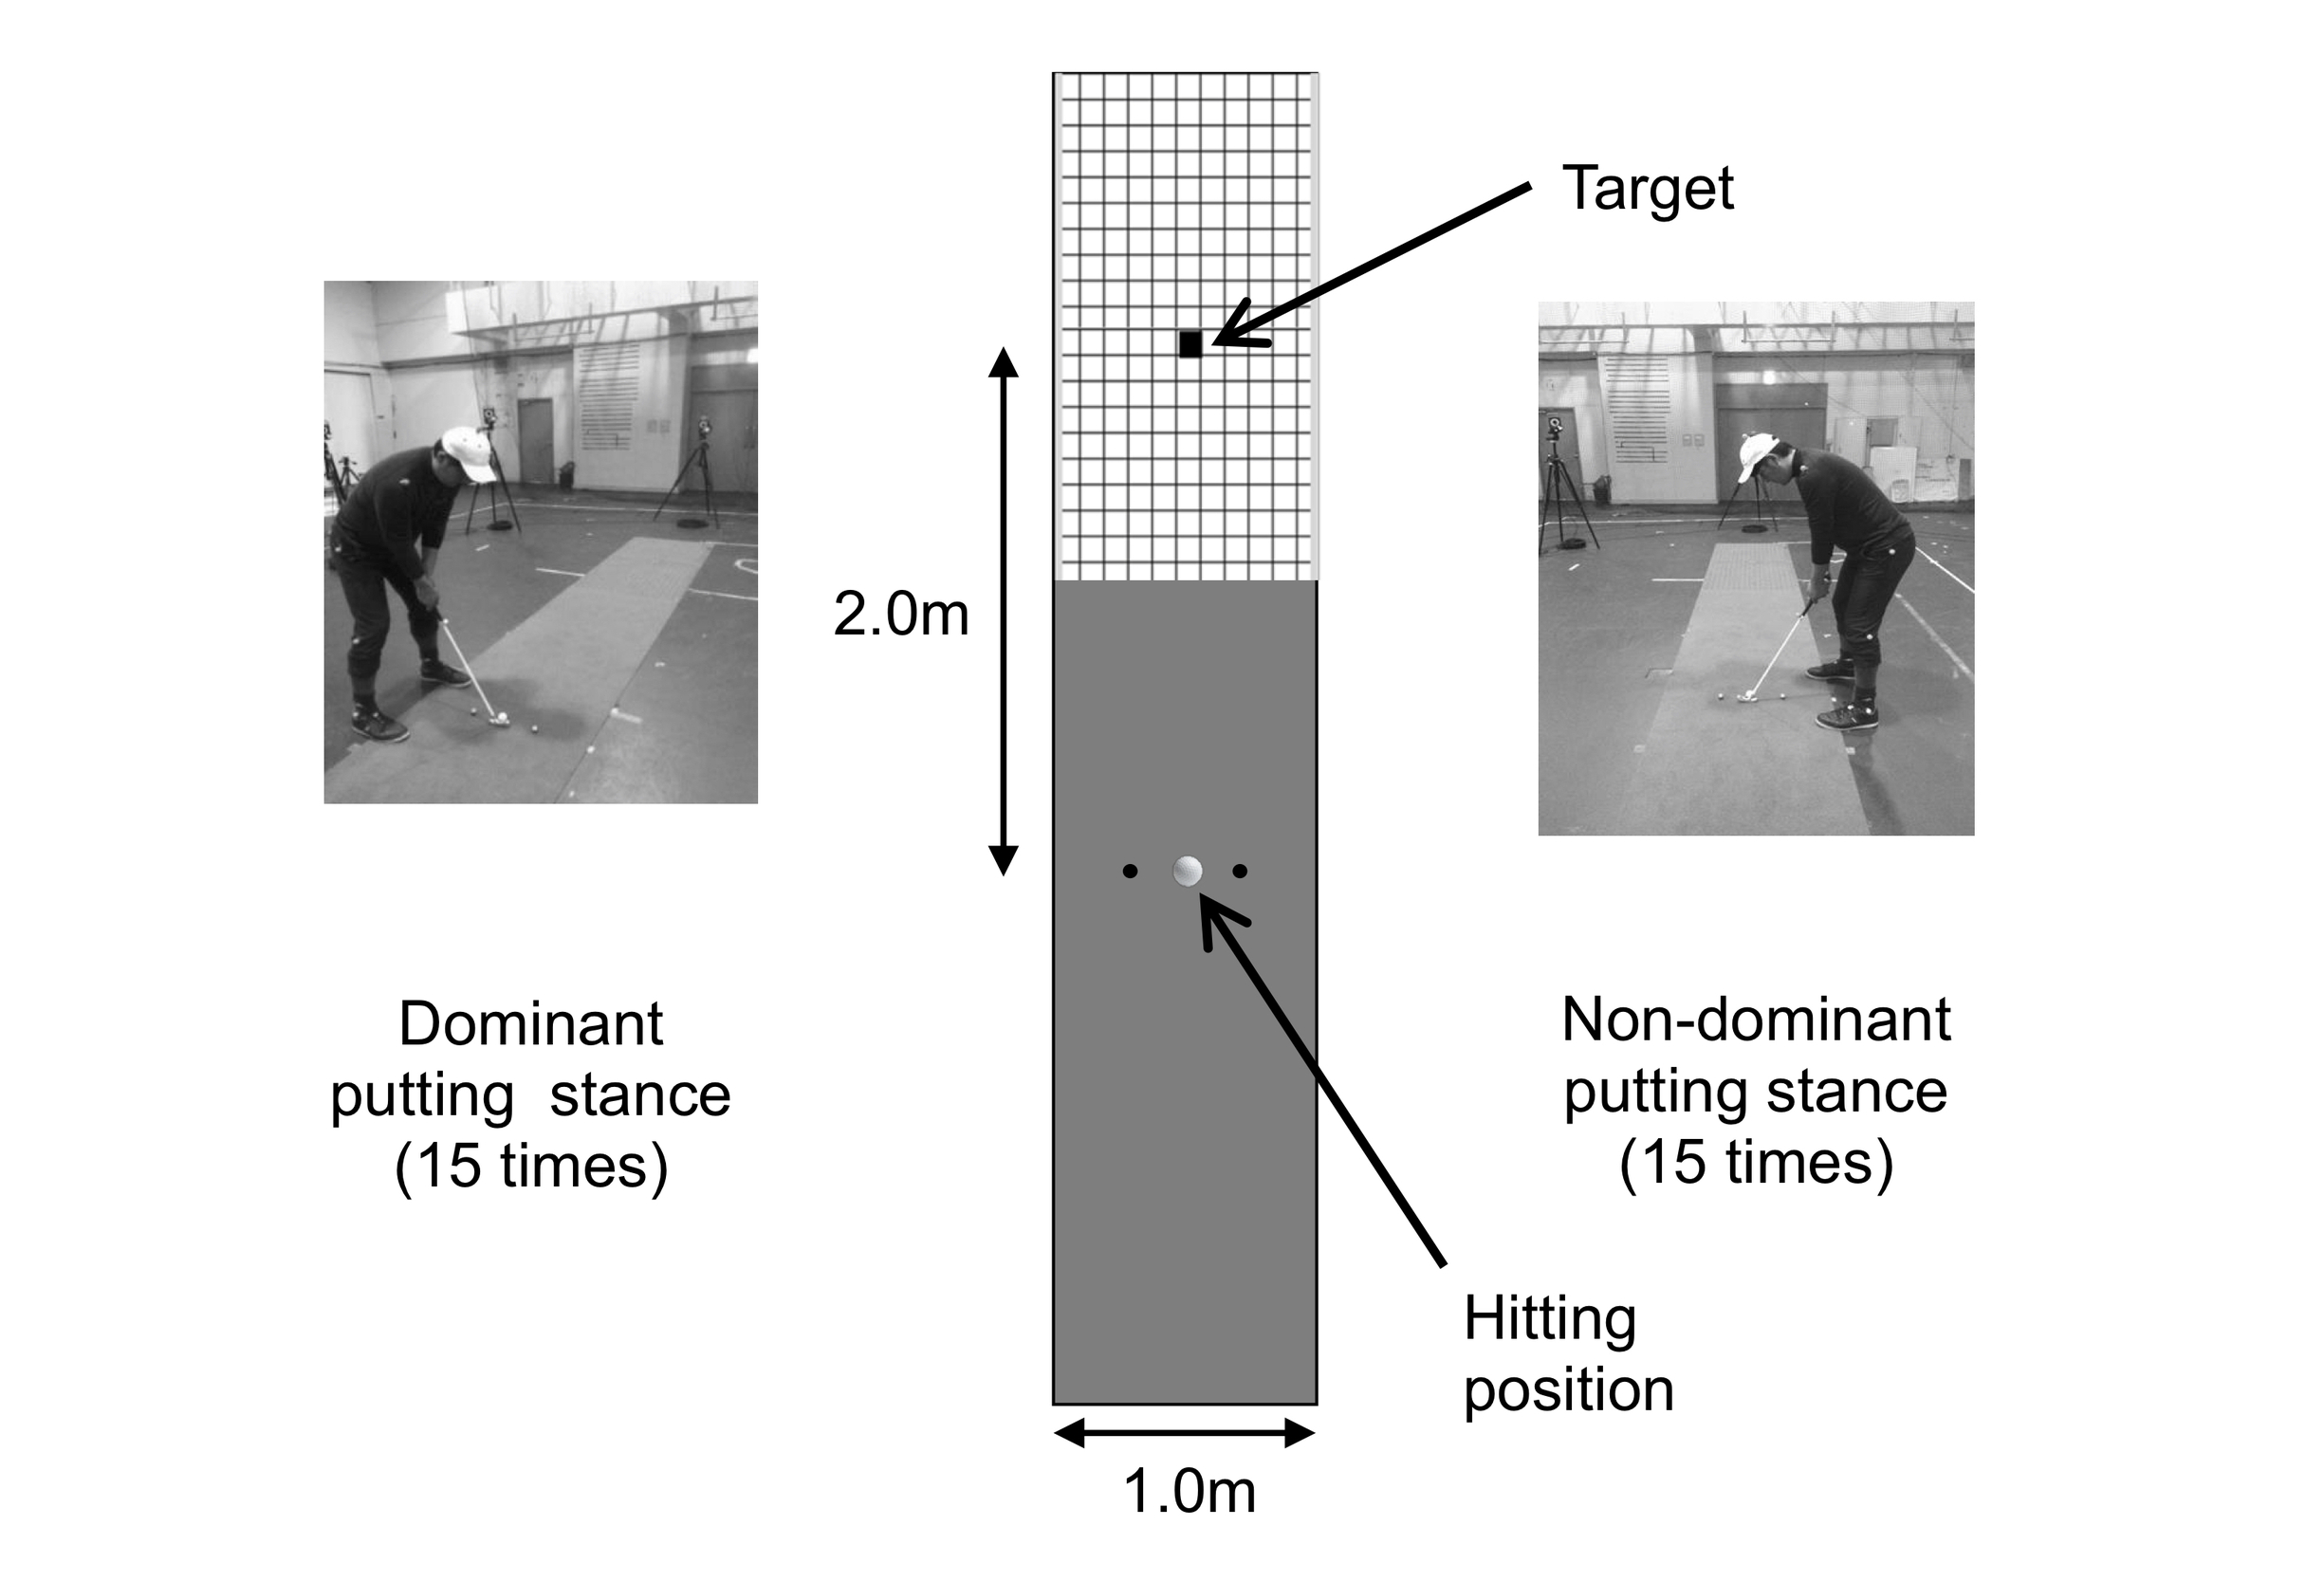
We investigated the PG putting ability from the different stances (Stance: Dominant, Non-dominant) by comparing with NG though the completion of a series of 4 days (Day: DAY1 to DAY4) trials in one week. The trial was first conducted from the dominant putting stance followed by putting from the non-dominant stance alternately one shot by one shot (Figure 1). This allowed us to investigate the characteristics of putting skill by eliminating feedback from the previous shot to the next shot. All participants putted from their dominant and non-dominant putting stances on a 5.0 m × 1.0 m artificial putter mat (Superbent putter mat, JPN) with 0.05m matrix grid line (Figure 2). The subjects were tasked with stopping the ball in the center of a square target (0.05m2 square box) that was 2.0 m from the putting position. All participants used TRANSAM CNC MILLED putter (LYNKS, USA) head that can be used for both dominant and non-dominant putting stance. The same golf ball (NIKE RZN platinum, USA) was also used. We gave verbal instruction to the participants to use an overhand grip, and to try to stop the ball as close to the square target as possible. We did not give any advice on putting stroke technique. After each putting trial, they could see where they stopped the ball from the target, but we did not provide any feedback regarding their results. The participants were allowed only one practice putt before the experiment. They took a 10-minute rest period between trials after putting 15 times and the next trial day was set more than one day later. A total of 30 putts were made alternating each putt between dominant and non-dominant putting stance (15 putts for each stance). Putting was limited to only 30 times in one day and the next trial began from the opposite stance (non-dominant to dominant).
Measurement
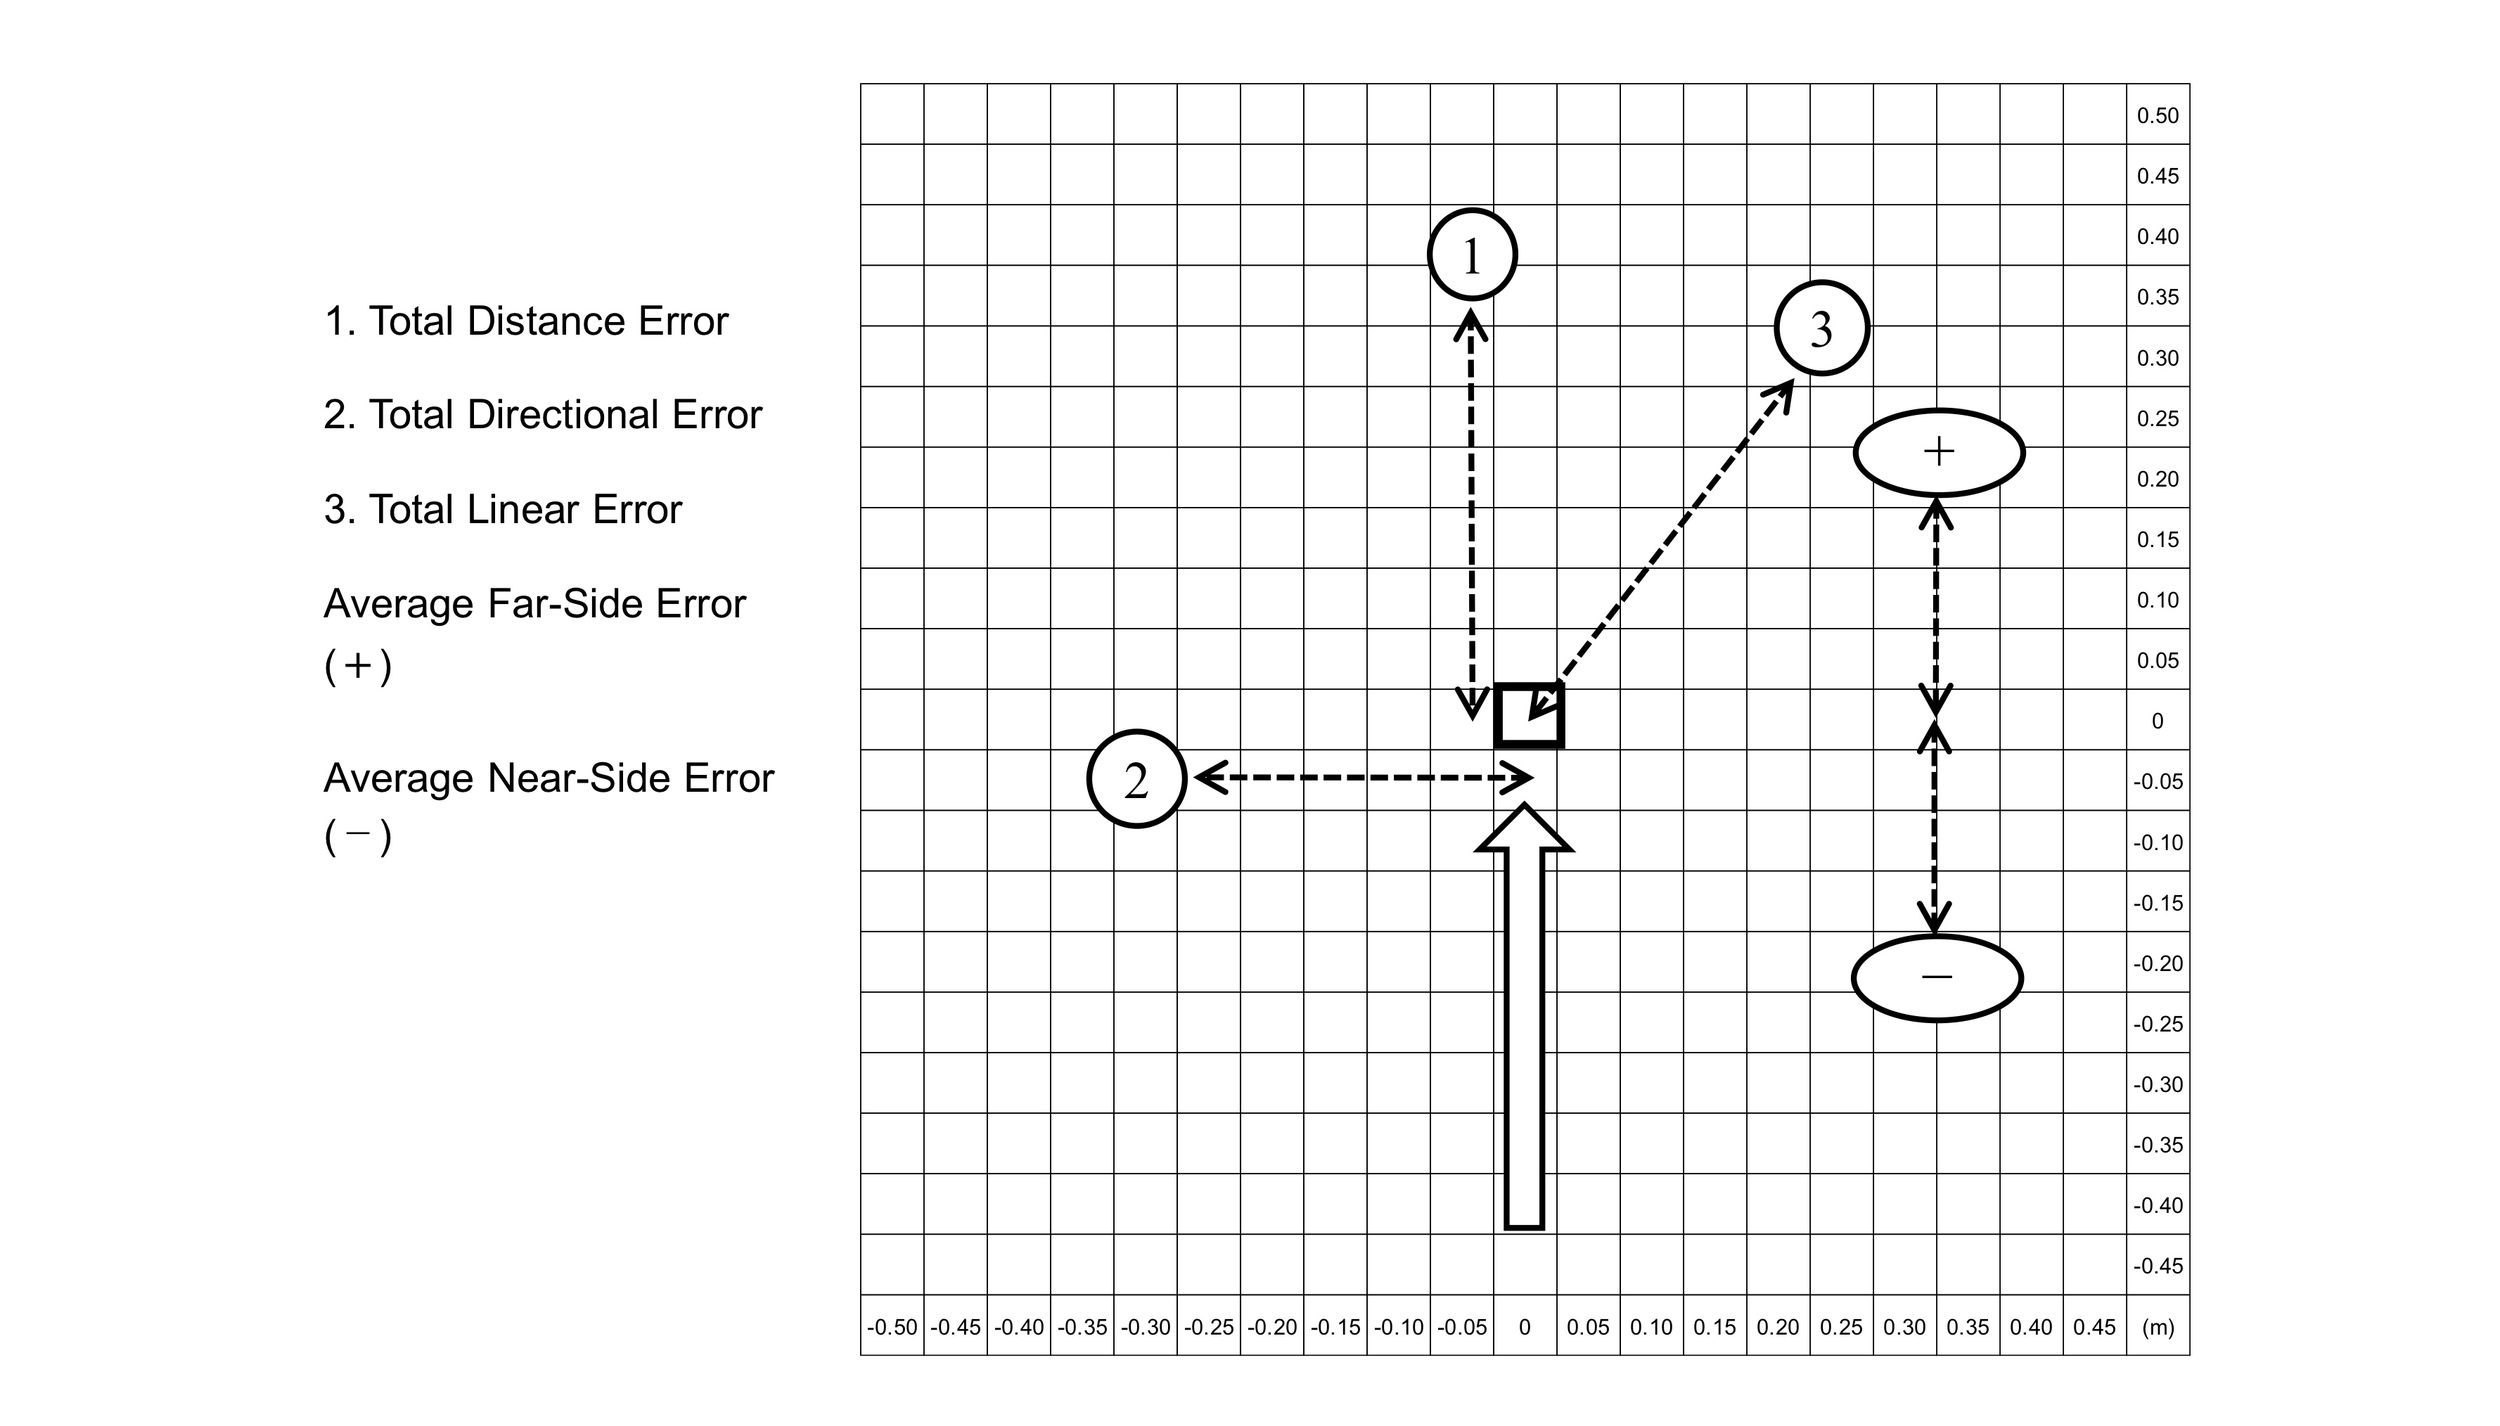
The distance from the target was measured by coordinated scaling on the putting mat (Figure 2). After the participant hit the ball we measured the distance from the target. The far side was defined as a positive value (+), the near side a negative value (-), the right side a positive value (+), and the left side a negative value (-). After measuring the positive or negative distance we then converted it to absolute error as the sum of distance of the 15 putts (1. Total Distance Error). The right and left distance was also calculated by the same equation (2. Total Directional Error). The diagonal distance calculated from the Total Distance Error and Total Directional Error to the target is defined as Total Linear Error (3) (Figure 2). This value was calculated from the following trigonometric equation: Total Linear Error = [(X’-X) 2 + (Y’-Y) 2] 1/2 where X’ and Y’ were coordinated from the position of the stop from 2m distance, and X and Y were coordinated from the center of the goal target (Lee et al., 2008; Perkins-Ceccato et al., 2003; Sim & Kim, 2010). Total Distance Error data in all trials (DAY1 to DAY4) was separated into NG and PG with distance over the target defined as Far-Side Error (+) and distance short of the target defined as Near-Side Error (-). Average for Far-side and Near-side distance error in NG and PG was then calculated.
Statistical Analysis
Statistical analysis was performed using software SPSS 24.0 (SPSS, IBM, JPN). Distance error data was entered into a 2 (Stance: Dominant, Non-dominant) × 4 (Day: DAY1, DAY2, DAY3, DAY4) × 2 (Group: NG, PG) mixed designed analysis of variance (ANOVA) for all three independent variables (Table 1 and Figure 3). If the Mauchly’s sphericity assumption was violated, Greenhouse-Giesser corrections for the p-value were reported. Effect size values were estimated using partial eta-squared (ηp2) and observed power (1-β). Bonferroni post hoc test was used for multiple comparisons among DAY1 to DAY4 trials. A comparison of the frequency on a far and near distance errors were applied a chi-squared non-parametric test (Table 2). Level of significance was set at p < 0.05.
Results
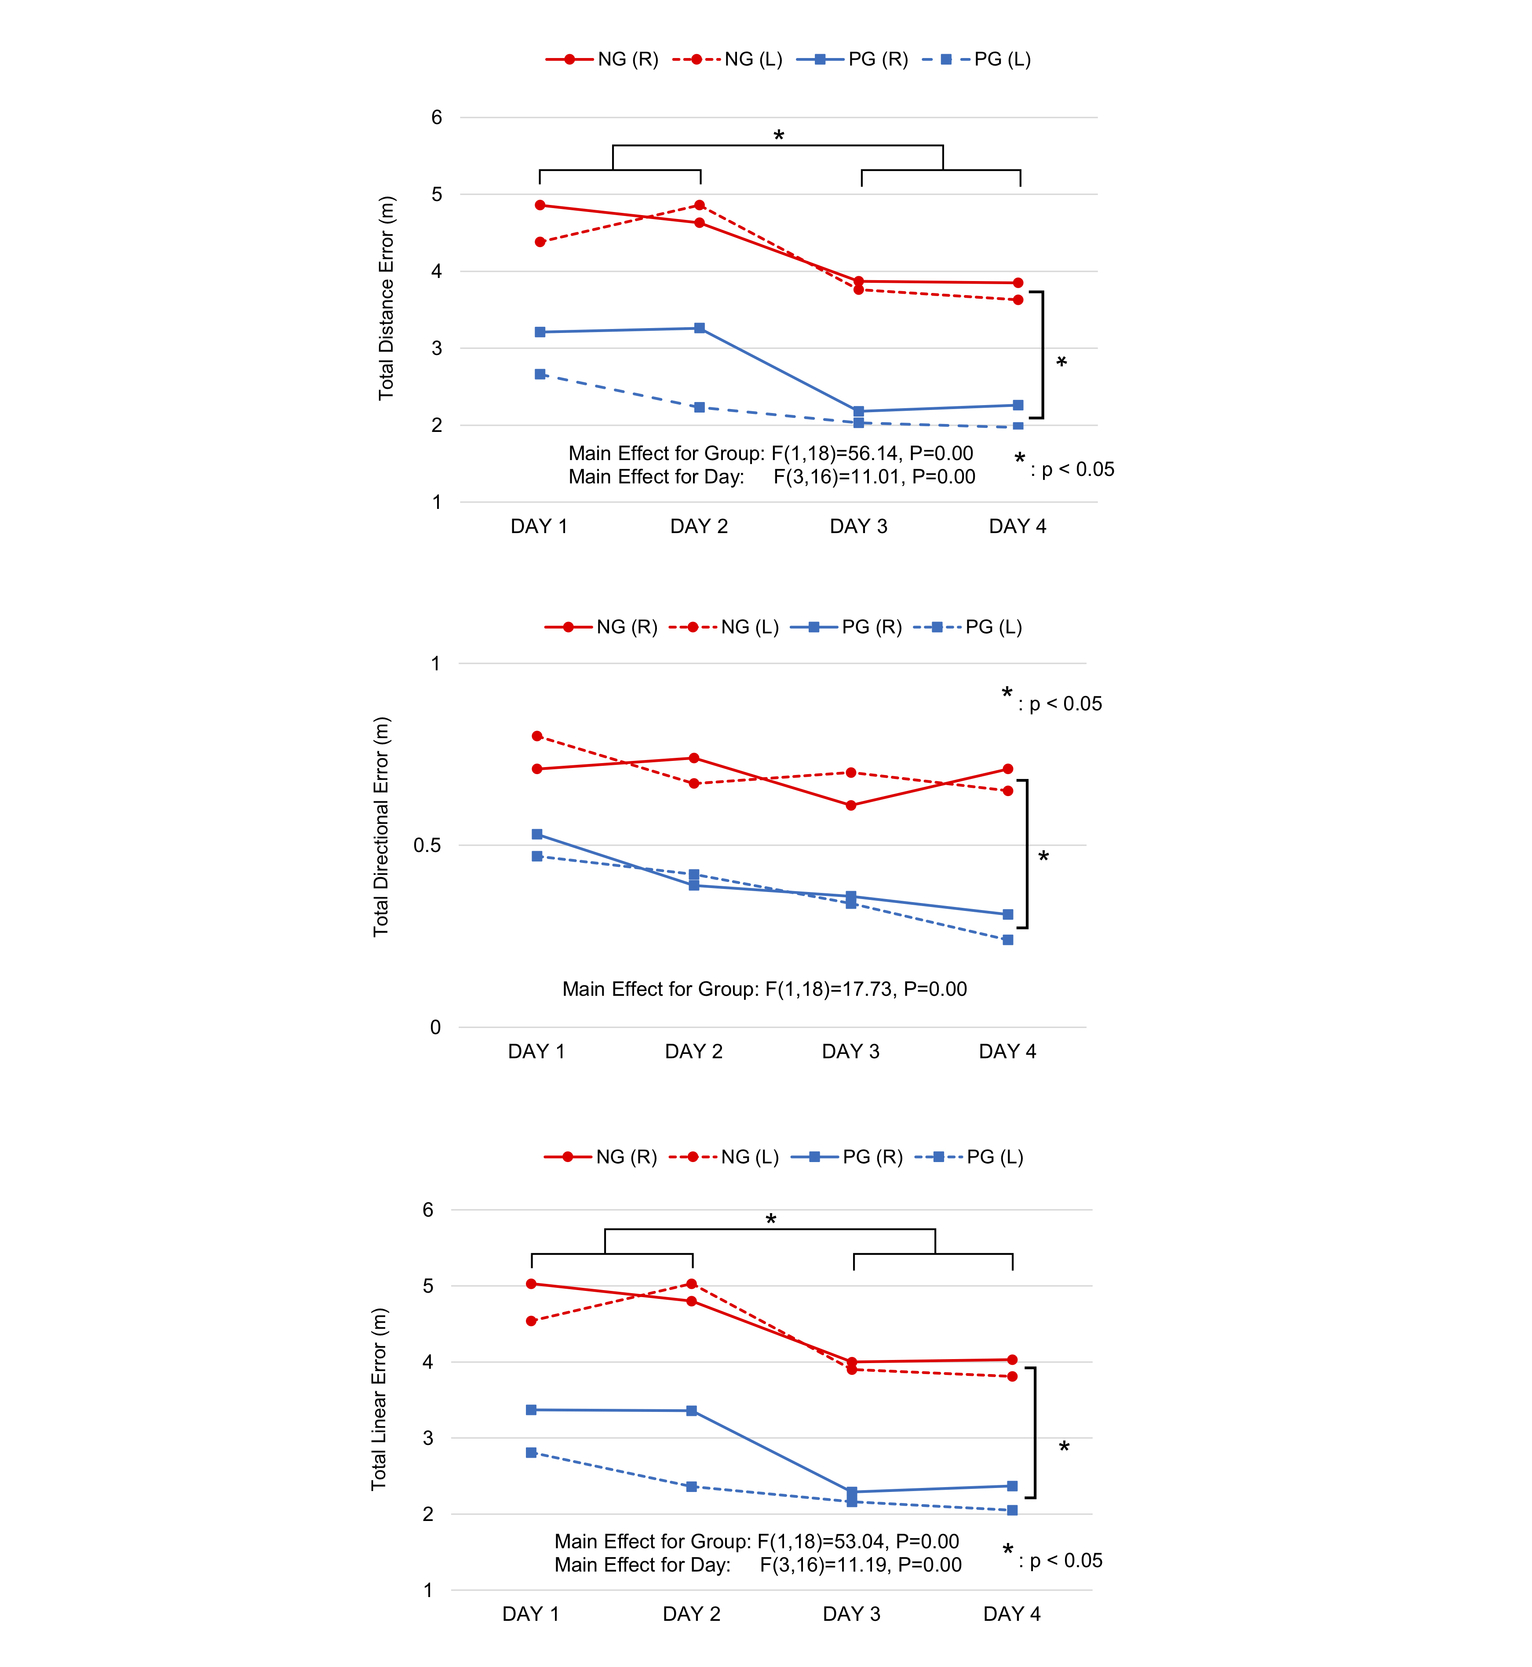
Table 1 shows the total distance error (Distance, Directional and Linear) in dominant and non-dominant putting stance of 15 putts from DAY1 to DAY4 in NG and PG. Figure 3 shows the change in stroke distance error among the 4 trials. The ANOVA for Total Distance Error and the second-order interaction (three-way interaction) involving Stance, Group and Day variable was not significant, F (3, 16) = 0.742, p = 0.531, ηp2 = 0.040, 1-β= 0.091. In a follow-up of the first-order interaction (two-way interaction), there were not significant difference between Stance x Group (F (1, 18) = 0.708, p = 0.411, ηp2 = 0.125, 1-β= 0.038), Day x Group (F (3, 16) = 0.360, p = 0.782, ηp2 = 0.020, 1-β= 0.116) and Stance x Day (F (3, 16) = 0.233, p = 0.873, ηp2 = 0.013, 1-β= 0.091). The main effect of Group was significant, F (1,18) = 56.140, p = 0.000, ηp2 = 0.757, 1-β= 1.000. Therefore, Total Distance Error in PG was a significantly less than NG in both putting stances (NG > PG). The main effect of Stance was not significant, F (1, 18) = 2.314, p = 0.146, ηp2 = 0.114, 1-β= 0.302. The main effect of Day was significant, F (3, 16) = 11.007, p = 0.000, ηp2 = 0.379, 1-β= 0.999. The result of Total Distance Error using a multiple comparison of DAY was significant in both putting stances (DAY1 > DAY3, DAY1 > DAY4, DAY2 > DAY3, DAY2 > DAY4).
The ANOVA for Total Directional Error and the three-way interaction involving Stance, Group and Day variable was not significant, F (3, 16) = 1.067, p = 0.371, ηp2 = 0.056, 1-β= 0.273. In a follow-up of the two-way interaction, there were not significant difference between Stance x Group (F (1, 18) = 0.327, p = 0.574, ηp2 = 0.018, 1-β= 0.084), Day x Group (F (3, 16) = 0.632, p = 0.598, ηp2 = 0.034, 1-β= 0.174) and Stance x Day (F (3, 16) = 0.696, p = 0.559, ηp2 = 0.037, 1-β= 0.188). The main effect of Group was significant, F (1,18) = 17.726, p = 0.001, ηp2 = 0.496, 1-β= 0.978. Therefore, Total Directional Error in PG was significantly less than NG in both putting stances (NG > PG). The main effect of Stance was not significant, F (1,18) = 0.081, p = 0.779, ηp2 = 0.004, 1-β= 0.058. The main effect of Day was significant, F (3,16) = 3.075, p = 0.035, ηp2 = 0.146, 1-β= 0.688. However, the result of Total Directional Error using a multiple comparison of DAY was not significant in both putting stances (F (3,16) = 2.095, p = 0.141, ηp2 = 0.282, 1-β= 0.436).
The ANOVA for Total Linear Error and the three-way interaction involving Stance, Group and Day variable was not significant, F (3, 16) = 0.715, p = 0.547, ηp2 = 0.038, 1-β= 0.192. In a follow-up of the two-way interaction, there were not significant difference between Stance x Group (F (1, 18) = 0.724, p = 0.406, ηp2 = 0.039, 1-β= 0.127), Day x Group (F (3, 16) = 0.349, p = 0.790, ηp2 = 0.019, 1-β= 0.114) and Stance x Day (F (3, 16) = 0.265, p = 0.851, ηp2 = 0.014, 1-β= 0.097). The main effect of Group was significant, F (1,18) = 53.039, p = 0.000, ηp2= 0.747 1-β= 1.000. Therefore, Total Linear Error in PG was significantly less than NG in both putting stances (NG > PG). The main effect of Stance was not significant, F (1, 18) = 2.451, p = 0.135, ηp2 = 0.120, 1-β= 0.317. The main effect of Day was significant, F (3, 16) = 11.190, p = 0.000, ηp2= 0.383, 1-β= 0.999. The result of Total Distance Error using a multiple comparison for DAY was significant in both putting stances (DAY1 > DAY3, DAY1 > DAY4, DAY2 > DAY3, DAY2 > DAY4).
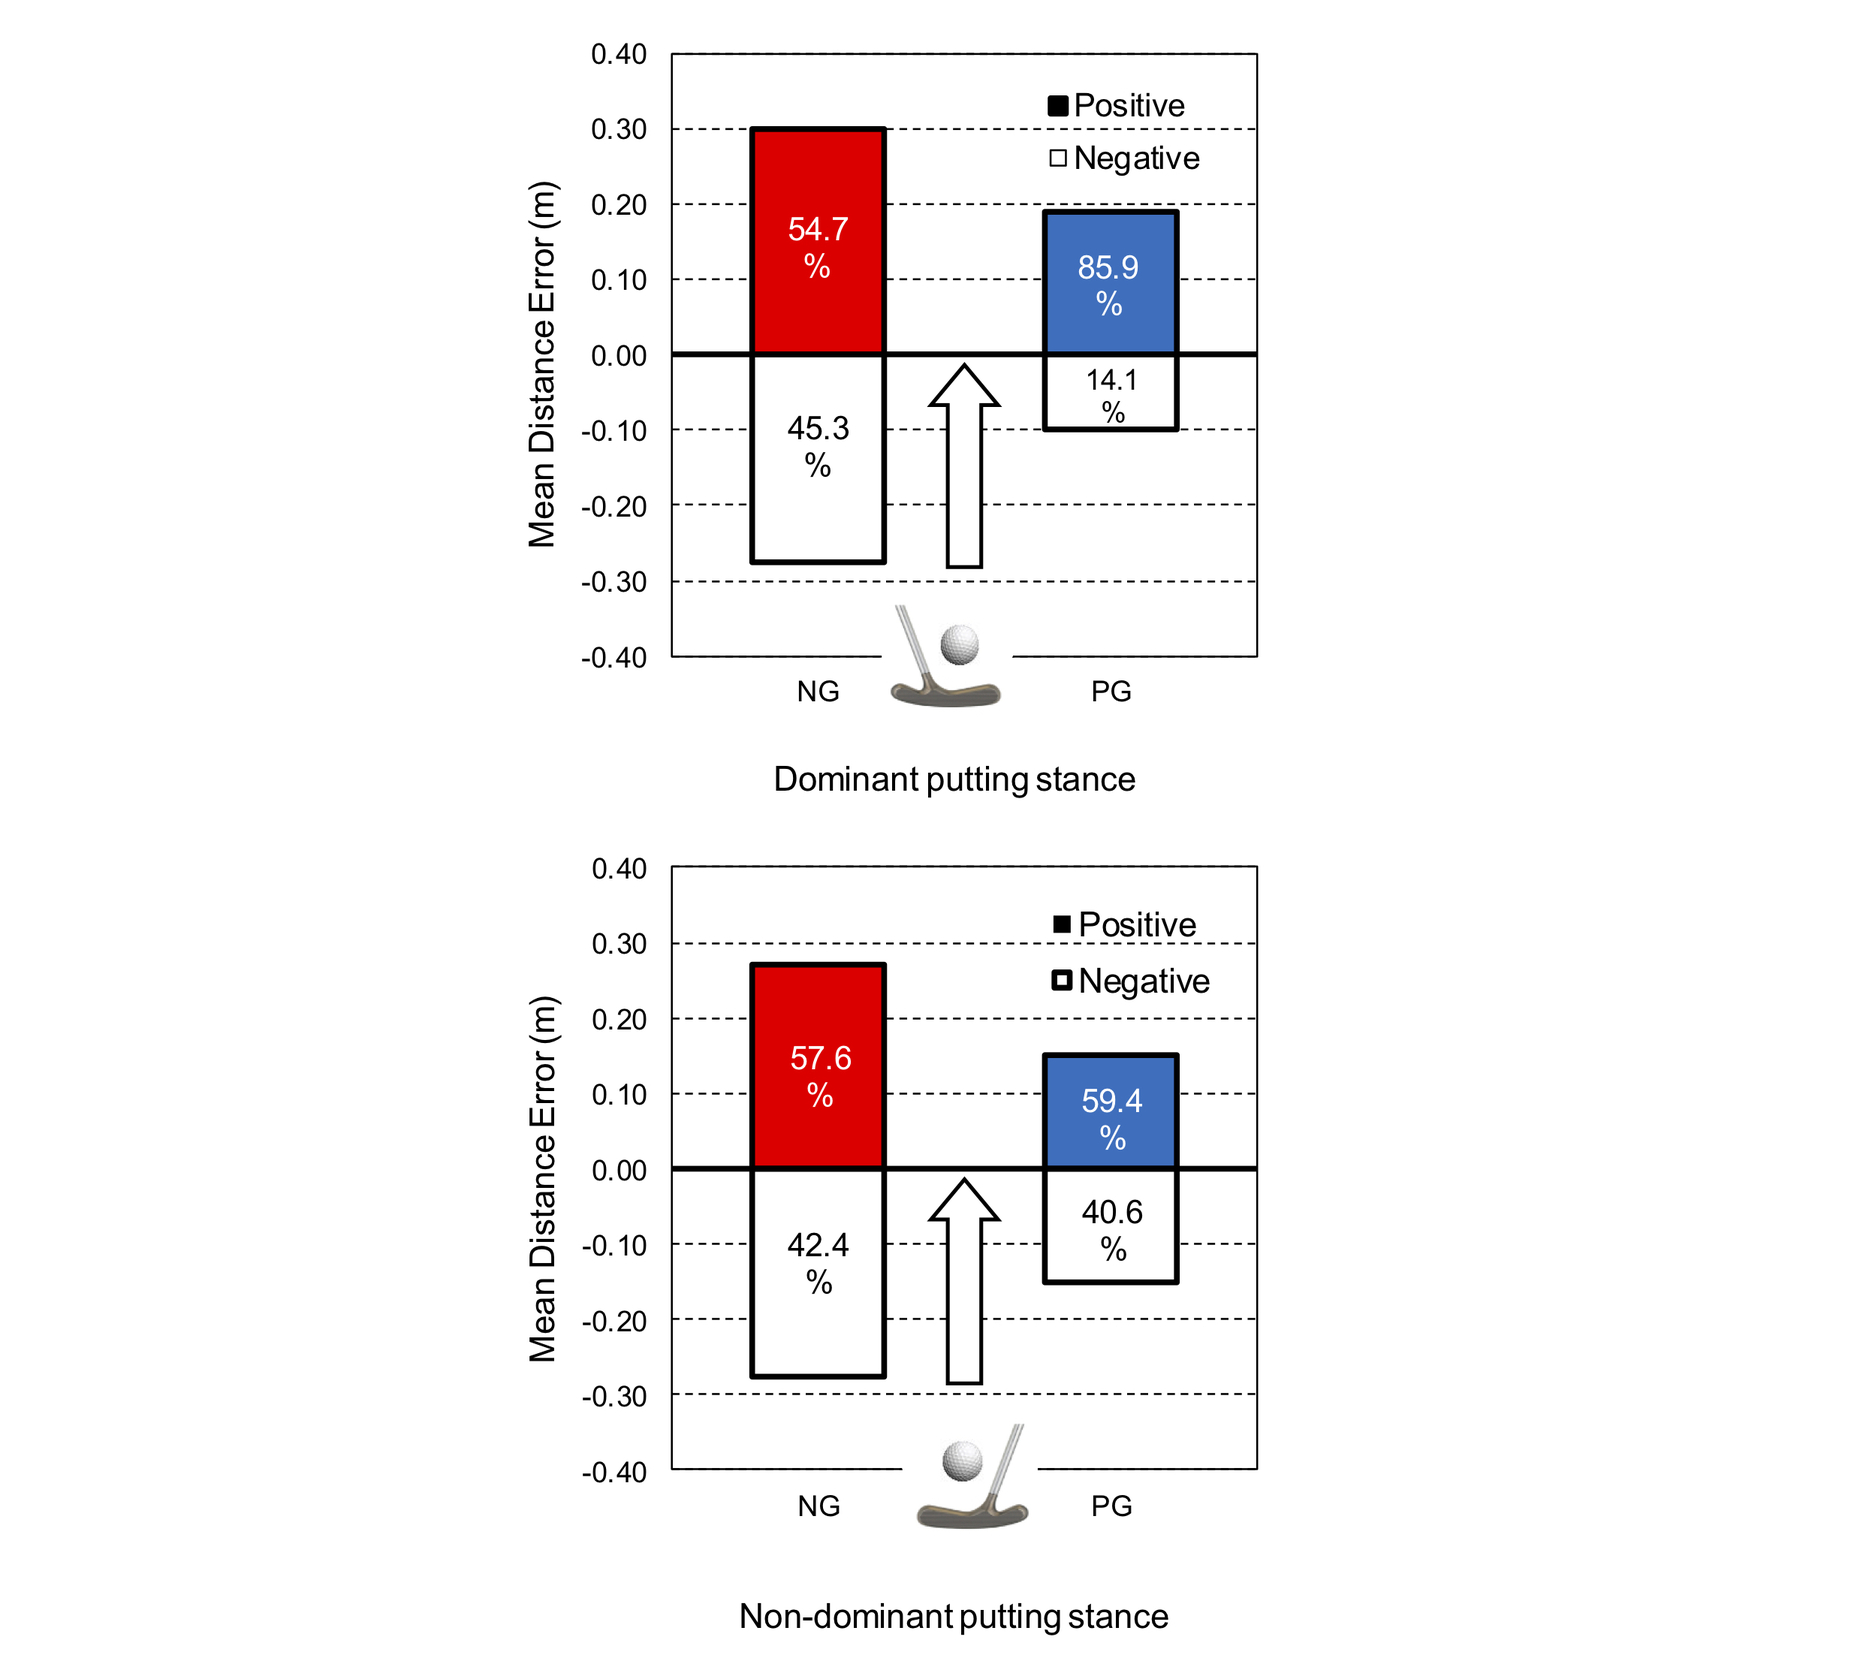
Table 2 and Figure 4 show the mean distance error of far (+) and near (–) side distance in NG and PG from both putting stances. PG showed significantly less error in far and near side than NG in both putting stance (NG > PG). The frequency of the ball stopping at the far side from both putting stances was significantly higher in NG and PG (Far-side > Near-side). Furthermore, the frequency of the ball stopping at the far side from dominant stance (85.9%) was significantly higher than non-dominant stance (59.4%) in PG over the 4 days trials. (Dominant > Non-dominant). But the frequency of near-side from dominant putting stance (14.1%) was significantly less than non-dominant stance (40.6%) in PG (Dominant < Non-dominant).
Discussion
The purpose of this study was to investigate putting ability using a trial carried out 4 times in one week by NG and PG to stop a ball on a target from dominant and non-dominant putting stances. The results showed that the Total Distance Error in PG was significantly smaller than NG in both dominant and non-dominant putting stance, indicating that PG have a high putting skill. Furthermore, the rate of the ball stopping at far side of the target when putting from the dominant stance in PG was significantly higher than near side (85.9% vs 14.1%). This shows that distance error in PG is small but that they tend to overshoot the target even when attempting to accurately stop the ball on the target. This could be due to experience gained from many hours of practice, creating a strong putting skill tendency to place the ball to the far side of the target. This trait is considered important for attaining consistent cup-in results on the putting green. In this study, it is believed that such a result was due to the trial being conducted in a low-pressure environment, and we have labeled this putting skill tendency as “Golfers Bias”. In DAY1 distance error was smaller in the non-dominant stance of PG compared to NG and was also not significantly different to dominant stance distance error. A reduction in distance error was also observed from DAY3, which indicates potential trainability. This indicates that PG showed high short putt ability in the non-dominant stance. In NG, Total Distance Error and Linear Error in both putting stances was significantly lower from DAY1, DAY2 to DAY3, DAY4. This shows there is a short term learning effect in putting ability from either the dominant or non-dominant stance, and indicates that non-dominant putting stance skill increased in parallel to putting ability in the dominant stance.
Hasegawa et al. (2016) compared movement action in 10 professional and 10 high-level amateur golfers who performed a cup-in putting task consisting of 100 putts from various distances between 0.6〜3.3m from dominant putting stance. PG displayed a greater ability in adjusting downswing speed even in short distance putts, and also displayed more consistency in movement. However, there was no significant difference in putting score between the two groups (Hasegawa et al., 2016). This indicates that even in a simple short distance putting task there is a possibility that through match experience PG understand that undershooting a target or reduced putting motion could occur (Hasegawa et al., 2013, 2016). It is interesting that there might be an unconscious counter-measure or tactic used that causes golfers to slightly overshoot a target to ensure they reach the cup even in a low-pressure environment from a short distance. We recognize that golfers need to perform putts in a different environment than in this experiment. However, we think it is a better indicator to use a target task rather than a cup-in task even in an outdoor putting task that is closer to actual playing conditions to be able to accurately investigate how firmly golfers are actually striking the ball. It is also necessary to conduct further studies using longer distance targets to investigate up to what distance PG tend to overshoot a target.
In this study PG showed significanly lower directional error than NG, but there was no significant difference between dominant and non-dominant stance within PG. The ability of PG to putt not only with consistent distance control but also consistent directional accuracy from the non-dominat stance indicates that they possess an ingrained fine motor skill even in the non-dominant stance. The results of this study also support the proposal that for golfers prone to the “Yips” putting from the non-dominant stance could help to produce a better putting outcome. Roberts and Turnbull (2010) found that after 30 right-handed NG conducted a putting task from a distance of 2.26m on an inclined surface of 25%, when a pseudoneglect task was included in the 90-putt task from the right sides that the hole is missed to the right more often (Roberts & Turnbull, 2010). It has also been reported that NG tend to miss a putt to the right of the hole because they have an unconscious directional bias towards facing right of the hole when addressing the ball (van Lier et al., 2011). This indicates that a right-handed NG who stands to the left of the ball has a physical directional error (Van Lier et al., 2011; van Lier et al., 2011). Oppositely, it has been made clear that experienced golfers have an accurate perception of the line to the target, and even if this line is incorrect there is a tendency for it to be slightly to the left of the target (van Lier et al., 2011). In putting experiments such as these the existence of a putting skill tendency when aiming for a clearly defined target has been made clear. In this study, a difference in lateral distance error was recognized due to the difference in golfing ability. It is still necessary to investigate the putting face angle in long distance putting using motion analysis to further understand reasons for this difference in ability.
Conclusion
In this study, we investigated the putting ability in PG by having them complete a putting task 4 times in one week from both their dominant and non-dominant putting stance and compared them to NG that completed the same task. The results showed that PG display significantly lower average Distance Error, Directional Error and Linear Error from the target than NG in both putting stances. However, there were no significant different between dominant and non-dominant putting stances in all distance error variables. This demonstrate that PG showed high short putt ability in the non-dominant stance. These results show that PG have a high level of putting skill from the non-dominant stance in addition to the dominant stance, which was shown from DAY1 of this study. Furthermore, it was shown when Distance Error was divided into far-side and near-side that the rate of far-side error in PG was 85.9% of total strokes, which was not found in NG. We surmise that distance error in PG from dominant putting stance is small but that they tend to overshot the target even in a low-pressure environment such as conducted in this study is influenced by a strong putting stroke technique.
Funding
The authors received no financial support for the research, authorship, and/or publication of this article.