Introduction
The Official World Golf Rankings (OWGR) and Women’s World Golf Rankings (WWGR) aggregate points from professional golf tournaments to provide a relative ranking of male and female golfers. Together, these ranking systems function to set the fields for major championships, world golf championships, and Olympic Games (Broadie & Rendleman, 2013). They also provide a relative measure of success for golfers and golf national sporting organisations (NSOs). Success at the professional level is often linked to the attainment of a top 100 ranking as it signifies that a golfer has “made it” and facilitates entry into golf’s most lucrative events.
In the past few decades, the pursuit of international sporting success has become a priority for many countries (De Bosscher et al., 2009). NSOs invest substantial capital into Athlete Identification and Development (AID) programmes to compete with rival nations. AID programmes aim to select gifted athletes and provide them with resources (e.g., coaching, sports science and sports medicine services, competition opportunities) to support their development (Cobley et al., 2012; Vaeyens et al., 2008). However, many dynamic factors contribute to an athlete’s career progression; thus, Athlete Development (AD) is often a non-linear and complex process (Baker & Horton, 2004; Gulbin, Weissensteiner, et al., 2013).
AID models unpack the complexity of the AD process by outlining the resources and learning environments required to deliver programmes from youth sports to the senior professional levels. Given that athletes are selected - and de-selected - at different points along the development spectrum, AID models can also include Athlete Identification (AI) criteria (i.e., selection variables) that aid in the selection process (Vaeyens et al., 2008). NSOs that advocate for best practices in AID call on evidence-based, peer-reviewed data to produce bespoke, sport-specific AD models (Gulbin, Croser, et al., 2013; Johnston et al., 2018). However, little peer-reviewed data are available to inform AID decisions in golf meaning that popular golf-specific models such as Golf’s American Development Model and Golf Canada’s Player Development Guide 2.0 rely on data from other sports (e.g., basketball, hockey, lacrosse) to guide programming decisions (Golf Canada, 2014; PGA of America, 2019). As a result, golf-specific models of AD are often generic and re-purposed to fit a golf context. For example, many NSO-produced golf AD models reference Bayli and Hamilton’s (2004) Long Term Athlete Development (LTAD) model (Côté & Vierimaa, 2014; Ford et al., 2011). The LTAD is a multi-sport model which provides training, competition, and recovery recommendations for age-defined development stages. However, the LTAD model has been criticised for (1) its focus on physical maturation, (2) lack of peer-reviewed data to support its claims (see Ford et al., 2011 for review) and (3) lack of sport-specific research (Côté & Hancock, 2014).
Recently the Foundations, Talent, Elite, Mastery (FTEM) framework (Gulbin, Croser, et al., 2013) emerged as the preferred AID resource for Australian NSOs. The FTEM framework provides stakeholders with a non-prescriptive scaffolding that allows NSOs to embed sport-specific data based on their unique developmental drivers. The FTEM’s Sport for Excellence pathway spans the AD process from the grassroots to retirement from senior international competition and comprises four macro-stages of AD. The FTEM’s macro-stages are further divided into 10 micro-stages (see Gulbin, Croser, et al., 2013) that include developmental drivers that influence the AID process. The FTEM recognises the inherent variability of developmental progression within and between sports (Gulbin, Weissensteiner, et al., 2013; McCue et al., 2019), and does not include fixed age boundaries at any stage. Rather FTEM allows for the non-linear movement of athletes both up and down the pathway. Undefined age boundaries afford NSOs greater flexibility to adjust age boundaries and/or the timeframe of each stage as required. Such flexibility to allow for sport-specific data and insights has been noted as one of the main benefits the framework offers to NSOs seeking to bolster the delivery and efficiency of their AID programs (Gulbin et al., 2014).
Quantitative analyses are increasingly used in sport to provide objective data to assist with designing sport-specific AD models. For example, a growing body of work examined the ranking pathways of players that reached the top 100 in the Association of Tennis Professionals (ATP) and Women’s Tennis Association (WTA) rankings (Kovacs et al., 2015; Kovalchik et al., 2017; Reid et al., 2014; Reid & Morris, 2013). These studies aimed to inform the structuring of AID programmes and provide yardsticks for stakeholders based on the age/time that players reached career milestones (Kovalchik et al., 2017; Reid & Morris, 2013). In one study, Kovalchik et al. (2017) reported that female top 100 players who entered the tour between 1990 and 2005 earned their first ranking at a mean age of 16.2 and took 4.3 years to transition to the top 100. Some research has also looked at the differences in career milestones between male and female top 100 players. Reid and Morris (2013) found that at 18 years of age, the average top 100 male was ranked outside the top 500, whereas Kovacs et al. (2015) reported that at 18, the average top 100 female had already reached the top 300. A variety of complex factors may contribute to gender differences in AD pathways, including psychological and physical maturation, training and competition exposures, participation rates (i.e., depth of competition) and socio-cultural factors (Coutinho et al., 2014; Delorme et al., 2010; Durand-Bush & Salmela, 2001; Güllich, 2017; Leite & Sampaio, 2012).
Regional differences may also influence the AD pathways of elite athletes. Studies in tennis report high correlations between a country’s number of top-ranked players and the number of professional tours and events in the region (Filipcic et al., 2013; Reid, Crespo, Atienza, et al., 2007). Recent work in golf has also reported differences in the time it took for top 100 ranked golfers from different geographic regions to reach ranking milestones (Koenigsberg et al., 2020). Like tennis, golfers compete on professional tours all over the world. For male golfers, the largest tours include the PGA Tour, European Tour, Japanese Tour, and the Asian Tour. Broadie and Rendleman (2013) used ranking data from 2002-2010 to investigate whether the OWGR was biased for or against any tour, showing that PGA Tour golfers were penalised by an average of 26-37 OWGR positions compared to non-PGA Tour golfers. These data imply otherwise identical players who play on professional tours in different regions can have different ranking pathways, despite similar scores. Showing the data used to inform AID models may differ as a function of gender and region.
Currently, little objective data exist to inform decision-making for golfers, coaches, and stakeholders involved in golf AID. This study aimed to investigate the career ranking pathways of male and female professional golfers from different regions who achieved a top 100 ranking. The outcome of this analysis may identify statistical benchmarks that NSOs and coaches can use as a resource to inform AID and career planning for emerging golfers.
Methods
Data
Data were obtained from the OWGR and WWGR lists from 1990-2019 and 2007-2019, respectively. The lists are updated weekly and include the name, country of origin, cumulative ranking points, and ranking of all golfers. Rankings are expressed in absolute terms, with the “1” ranking reflecting the best-ranked golfer across all tours. Golfers who played parts of their careers before 1990 for males, and 2007 for females were excluded to ensure that only golfers whose data were available for their full careers were included. A recent study reported that the ranking pathways of male golfers who had achieved a top 100 ranking between 1990-2018 had changed significantly over time with younger generations of golfers reaching milestones at earlier ages and in less time (Koenigsberg et al., 2020). In keeping to their specific recommendations, only data from golfers born after 1978 were selected for this study. For females, all golfers who obtained a top 100 ranking between 2007-2019 were born after 1978; thus, no exclusions were required. In total, data were collected on 257 males (Mean age = 32.79, SD = 5.04) and 183 females (Mean age = 26.98, SD = 4.02) who held a top 100 ranking at some point in their career.
To examine the ranking pathways of top 100 ranked golfers, the ages that golfers reached career ranking milestones were investigated. Ranking milestones were based on previous benchmarking work in golf (Koenigsberg et al., 2020) and included the ages that golfers a) first received a professional ranking (along with their respective ranking position); and b) first entered the top 1000, 750, 500, 400, 300, 200, and 100 in the OWGR/WWGR. Additionally, the time taken to transition between ranking milestones (i.e., transition time – TT) and the total time taken from first ranking to first reaching the OWGR/WWGR top 100 (i.e., development time – DT) was determined. The ages at which golfers declared professional status was also calculated. However, the specific dates that golfers declared professional status were not available for the complete sample. Thus, in agreement with previous work (Koenigsberg et al., 2020), the date that golfers turned professional was normalised to July 1st of the given year.
Statistical analyses
Mapping the pathway and gender comparisons
The first set of analyses aimed to describe and compare the pathways that male and female golfers take to the top 100. Using each golfer’s date of birth, date of first ranking, and normalised data of declaring professional status, the mean ages that golfers reached ranking milestones, age turned professional, first absolute ranking, TTs, and overall DT were calculated. To investigate differences in the pathways between male and female golfers, independent samples t-tests (p < 0.01) were performed on each dependent variable. In cases where the assumption of normality was violated, Mann-Whiney U tests were substituted to confirm t-test results. Where unequal variances were confirmed, Welch t-tests were reported. Measures of effect size (Cohen’s d) were reported for each dependent variable.
Regional analysis
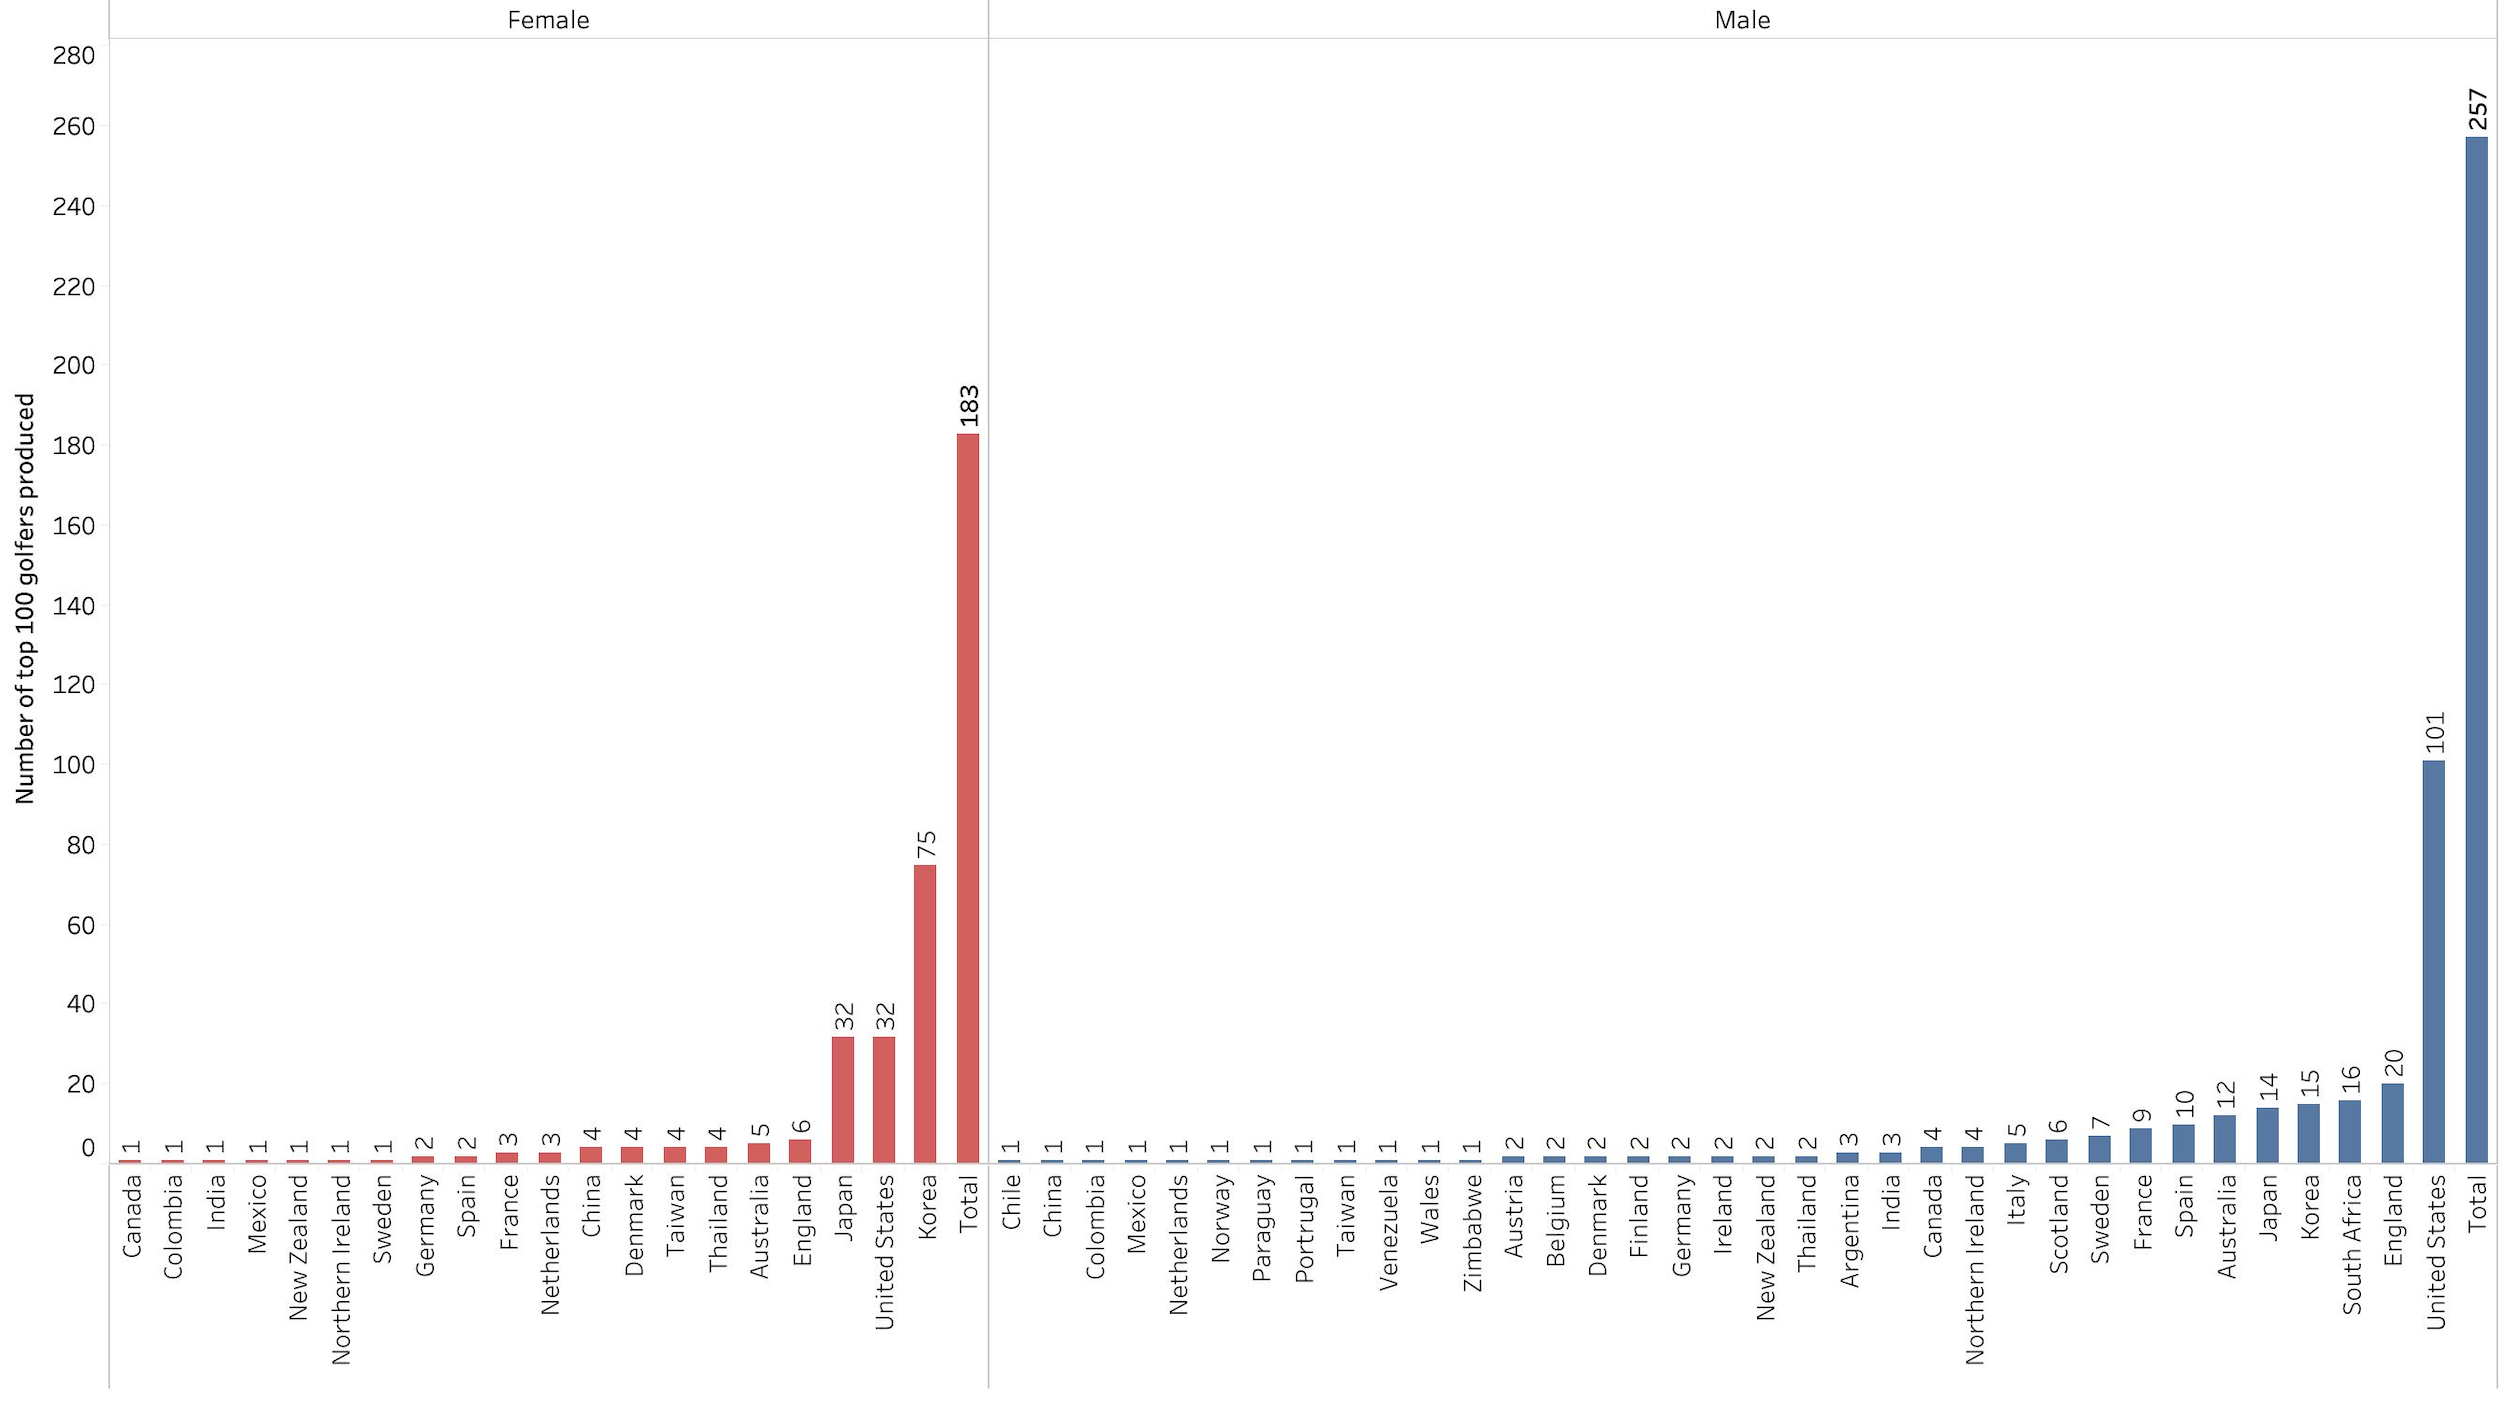
Analyses were also performed to determine whether regional differences influenced the ranking pathways of top 100 golfers. Golfers were assigned to one of three regional groups: Americas (i.e., North and South America) (n = 113 males, 35 females), Europe (n = 77 males, 22 females), and AAO (i.e., Asia, Africa, and Oceania) (n = 67 males, 126 females). While regional groups were assigned based on the geographic proximity of continents, socio-cultural and sporting system differences may exist between countries in similar regions (Baker & Horton, 2004; De Bosscher et al., 2009). While many countries have produced male and female top 100 players, most have only produced a small number (see Figure 1). Thus, to develop groups with a meaningful sample size, combined, regional groups were used. Regional analyses were carried out separately for males and females. The mean ages that golfers reached ranking milestones, age turned professional, first absolute ranking, TTs, and DT were calculated for each regional group. To test for differences in ranking pathways between regions, multiple one-way analysis of variance (ANOVA) tests were performed on all dependent variables (p <0.01). Levene’s tests were used to determine equality of variances; for variables where unequal variances were confirmed, Welch ANOVA tests were carried out. Where a significant main effect was found, post-hoc comparisons using Tukey or Games-Howell (i.e., unequal variances confirmed) were performed. A Shapiro-Wilk Normality test confirmed non-normal distribution of data; therefore Kruskal-Wallis (K-W) tests were also carried out to confirm all ANOVA results. Measures of effect size (Partial η2) were produced for each dependent variable.

Results
The ranking milestones of top 100 players
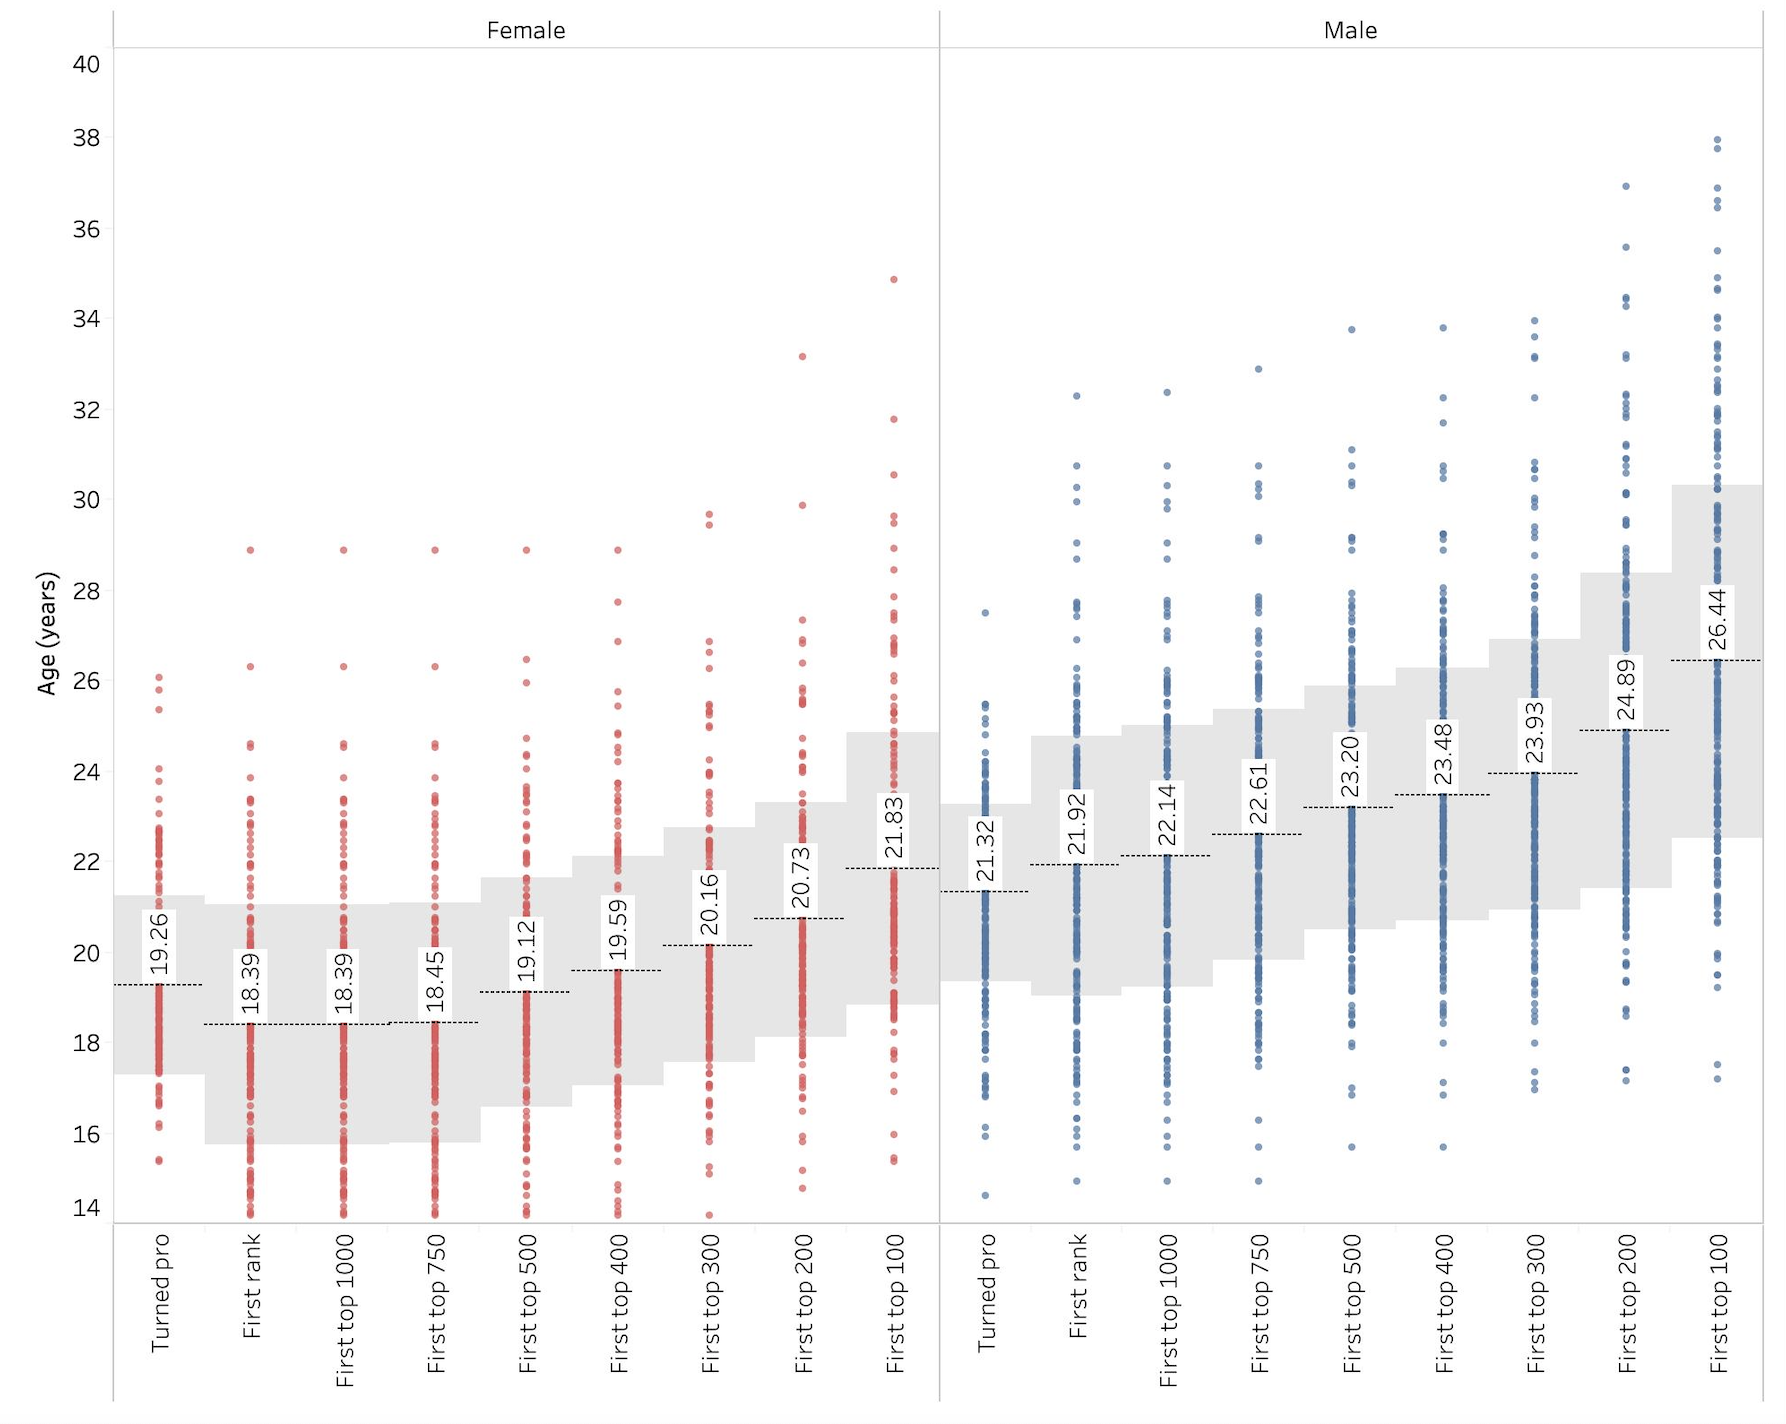
Figure 2 shows the mean ages at which male and female top 100 golfers born after 1978 turned professional and reached ranking milestones. Female top 100 golfers reached all ranking milestones at significantly younger ages than their male counterparts. This was due, in part, to female golfers receiving their first ranking at significantly younger ages; with the mean age of first ranking for females occurring at 18.39 (SD = 2.65) years of age compared to 21.92 (SD = 2.88) for males. Female golfers were first ranked about one year before they turned professional, while males generally turned professional prior to receiving their first ranking. Female golfers also took significantly less time to reach the top 100 (i.e., DT) with a mean of 3.44 years (SD = 1.87) compared to 4.52 years (SD = 3.10) for males. This was due to males taking longer to transition between ranking milestones at more points along the pathway than females. Yet not all the gender differences in TTs were statistically significant and most accounted for relatively small portions of overall career progression (see supplementary table 1b). For instance, no absolute difference between genders at any single TT was greater than 0.45 years. Despite most of the differences in TTs between males and females being relatively small, the cumulative product of these values may explain the significant differences seen in overall DT. The difference in DT further contributed to the increasing age differentials found between the males and females at ranking milestones. For instance, while females were first ranked 3.53 years younger than males, this increased to 4.61 years of age by the attainment of a top 100 ranking. Meaures of effect size further support these trends. Differences in the ages golfers reached ranking milestones reflected large effect sizes throughout the ranking pathway (see supplementary table 1a). In contrast, effect sizes for TTs varied between small and medium where signifncant differences were found (see supplementary table 1b).

Regional differences
OWGR
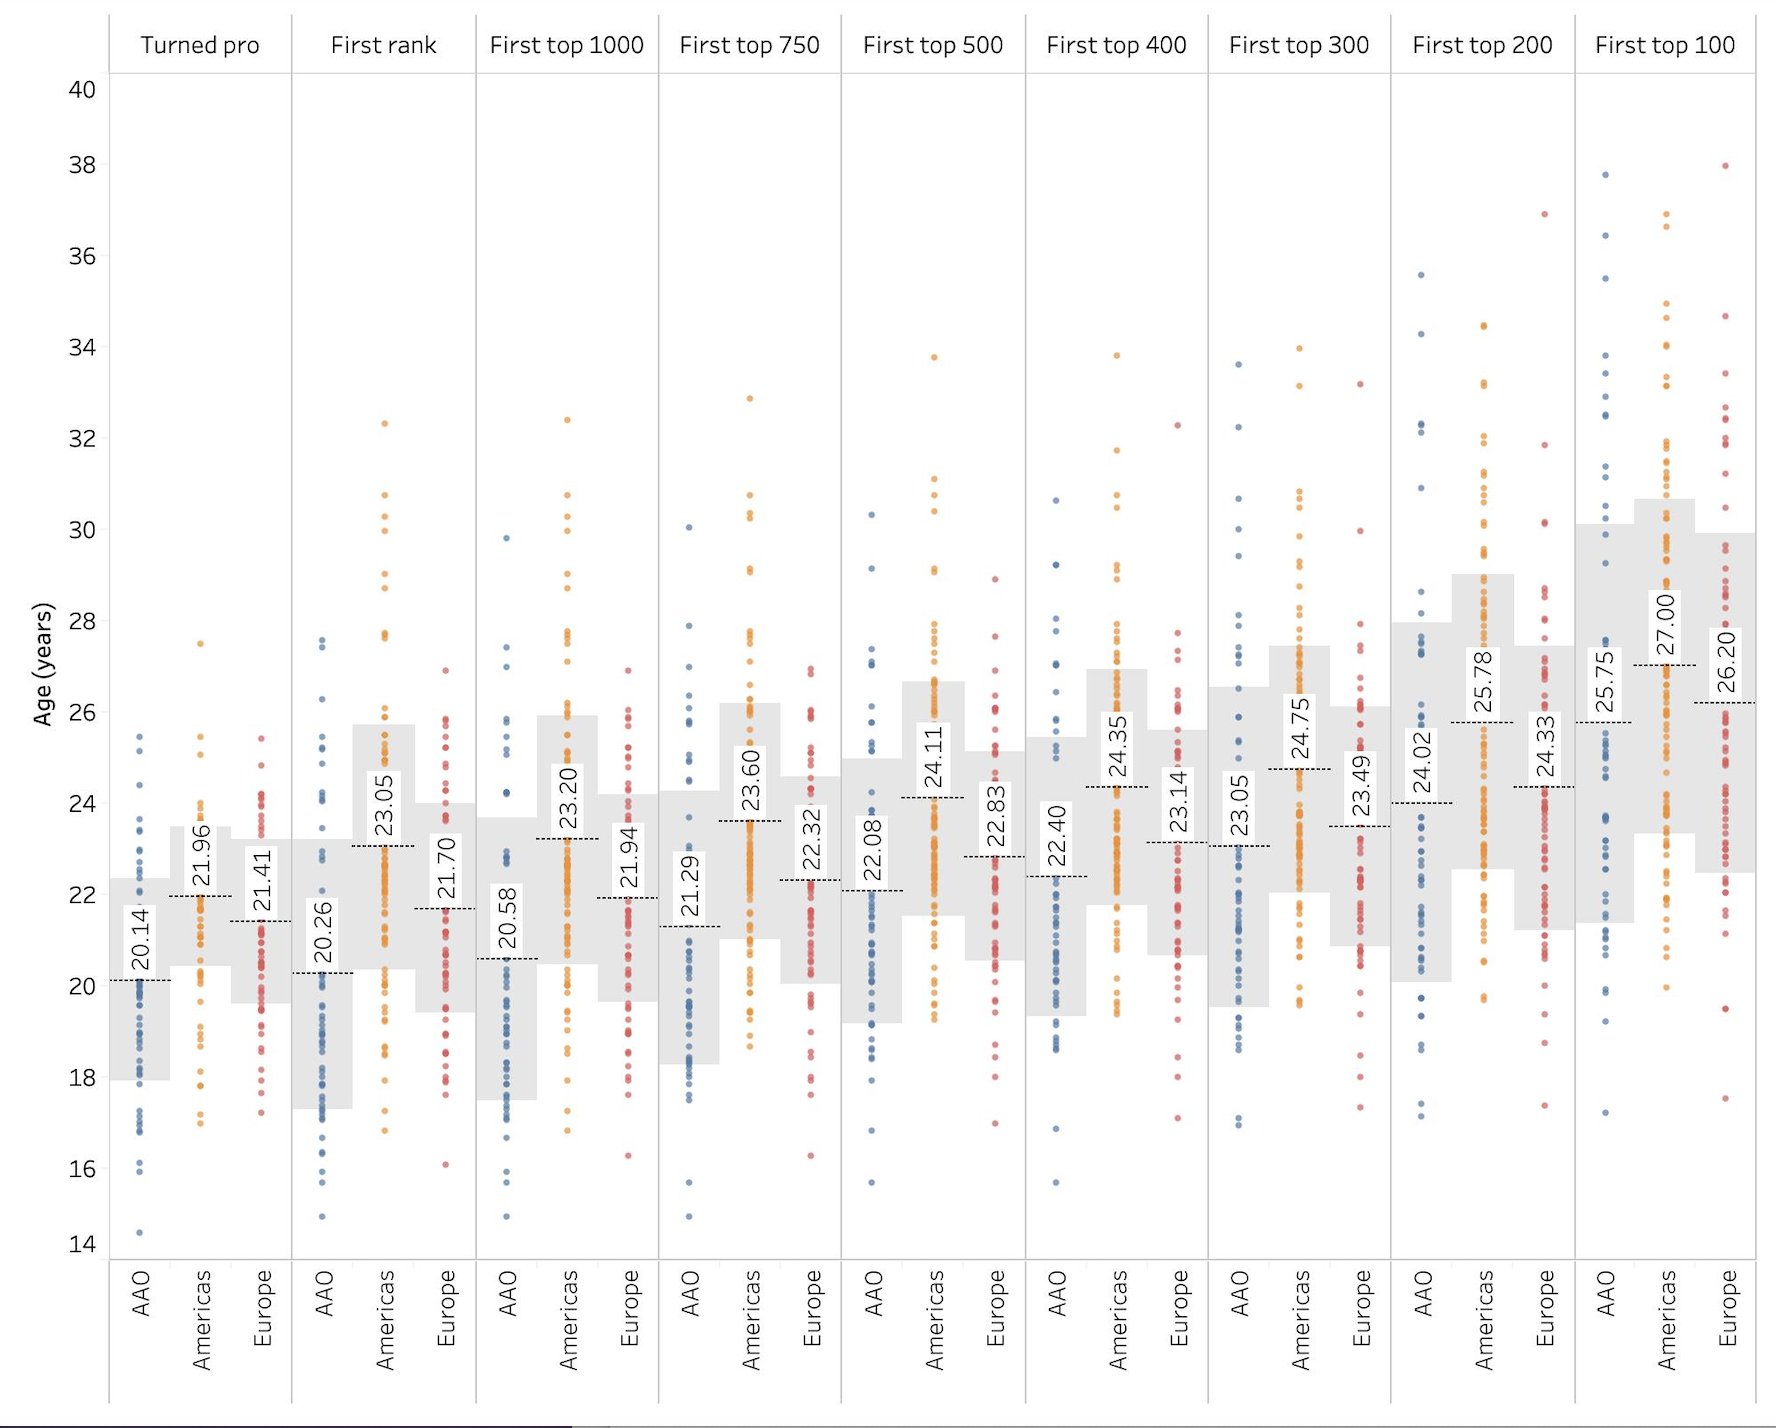
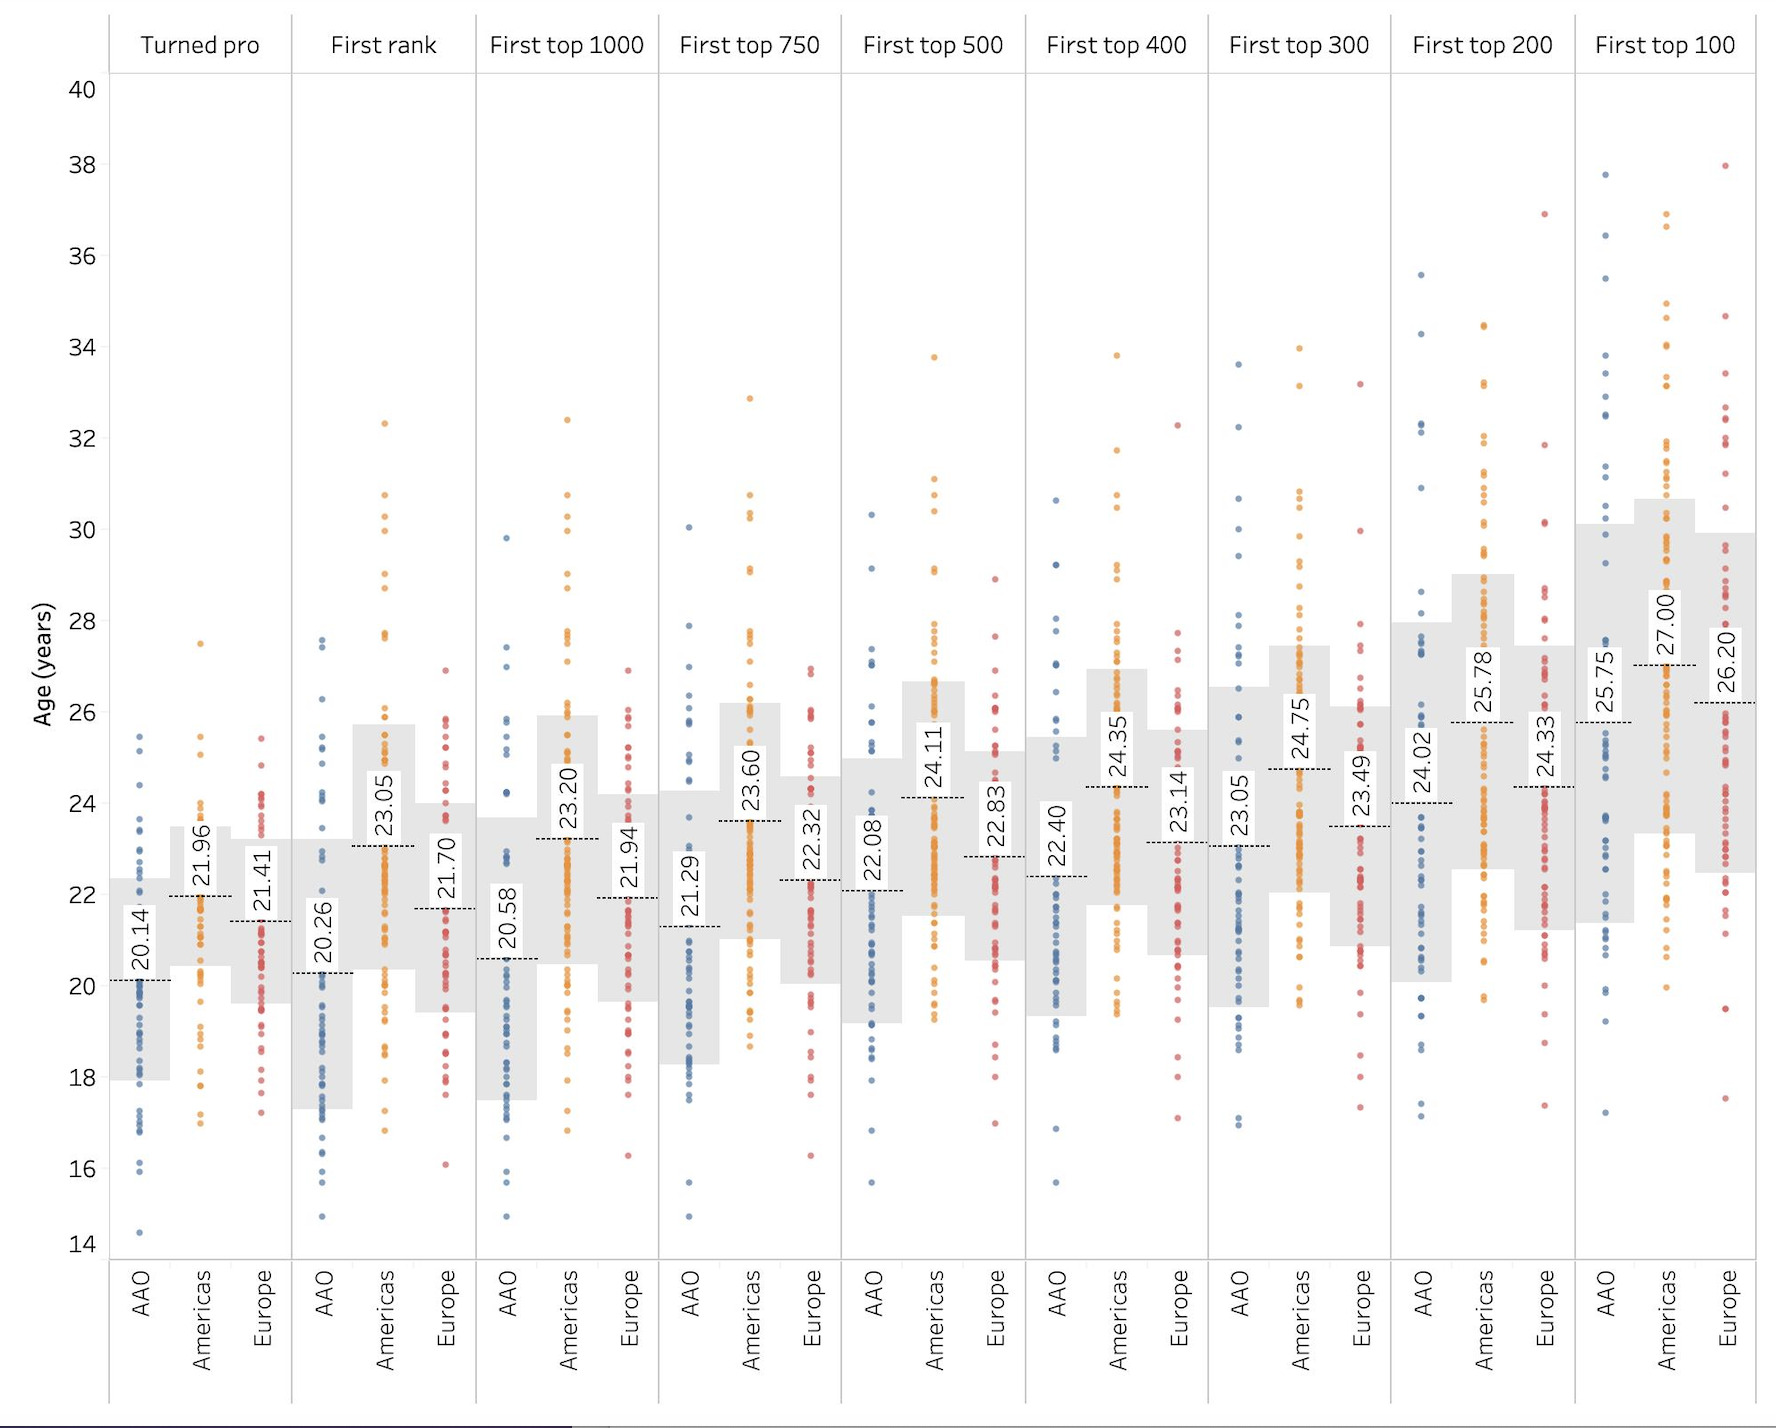
Figure 3 shows the mean ages that male golfers from the three regional groups turned professional and reached ranking milestones (see supplementary table 2b for data on TTs and first absolute ranking). All groups were significantly different in terms of golfers’ age at first OWGR. Specifically, golfers from the Americas were generally the oldest at this milestone followed by the Europeans and then those from AAO. On average, golfers from all groups turned professional before they were first ranked. No statistically significant difference between the ages that the Americas and European groups turned professional were present. Upon declaring professional status, golfers from the Americas took close to one-year to receive their first OWGR, while golfers from Europe and AAO were generally ranked soon after becoming professionals – resulting in the significant differences seen between all regions at age of first OWGR. Golfers from the Americas reached ranking milestones (all but age at first top 100 OWGR) at significantly older ages than those from Europe and AAO. European golfers reached milestones older than golfers from the AAO group, but this was only significant during the early stages of the golfers’ careers (e.g., age at first ranking and age at first top 1000 ranking). Where significant differences in ranking milestones where found, measures of Partial η2 were between medium and large. Notably, across all groups an inverse relationship was found between the mean age at first OWGR and total DT; that is, groups that were first ranked at older ages took less time to reach the top 100 (Americas = 3.96 years, Europe = 4.50 years, AAO = 5.49 years). However, this difference was only significant between golfers from the Americas and AAO. The amount of time taken to transition between ranking milestones (i.e., TT) was highly variable and accounted for relatively small portions of DT. In turn, small effects and no significant differences at any individual TT were found between groups. As DT is the cumulative product of individual TTs, groups with greater DTs took longer to transition at one or more points on the ranking pathway. Groups that received their first OWGR at younger ages had consistently higher TTs for most of the pathway; thus, a “catch-up” effect took place (i.e., the age differentials that golfers from different regions reached ranking milestones gradually decreased throughout the pathway). By the attainment of a top 100 OWGR, no significant age differences were found.
WWGR
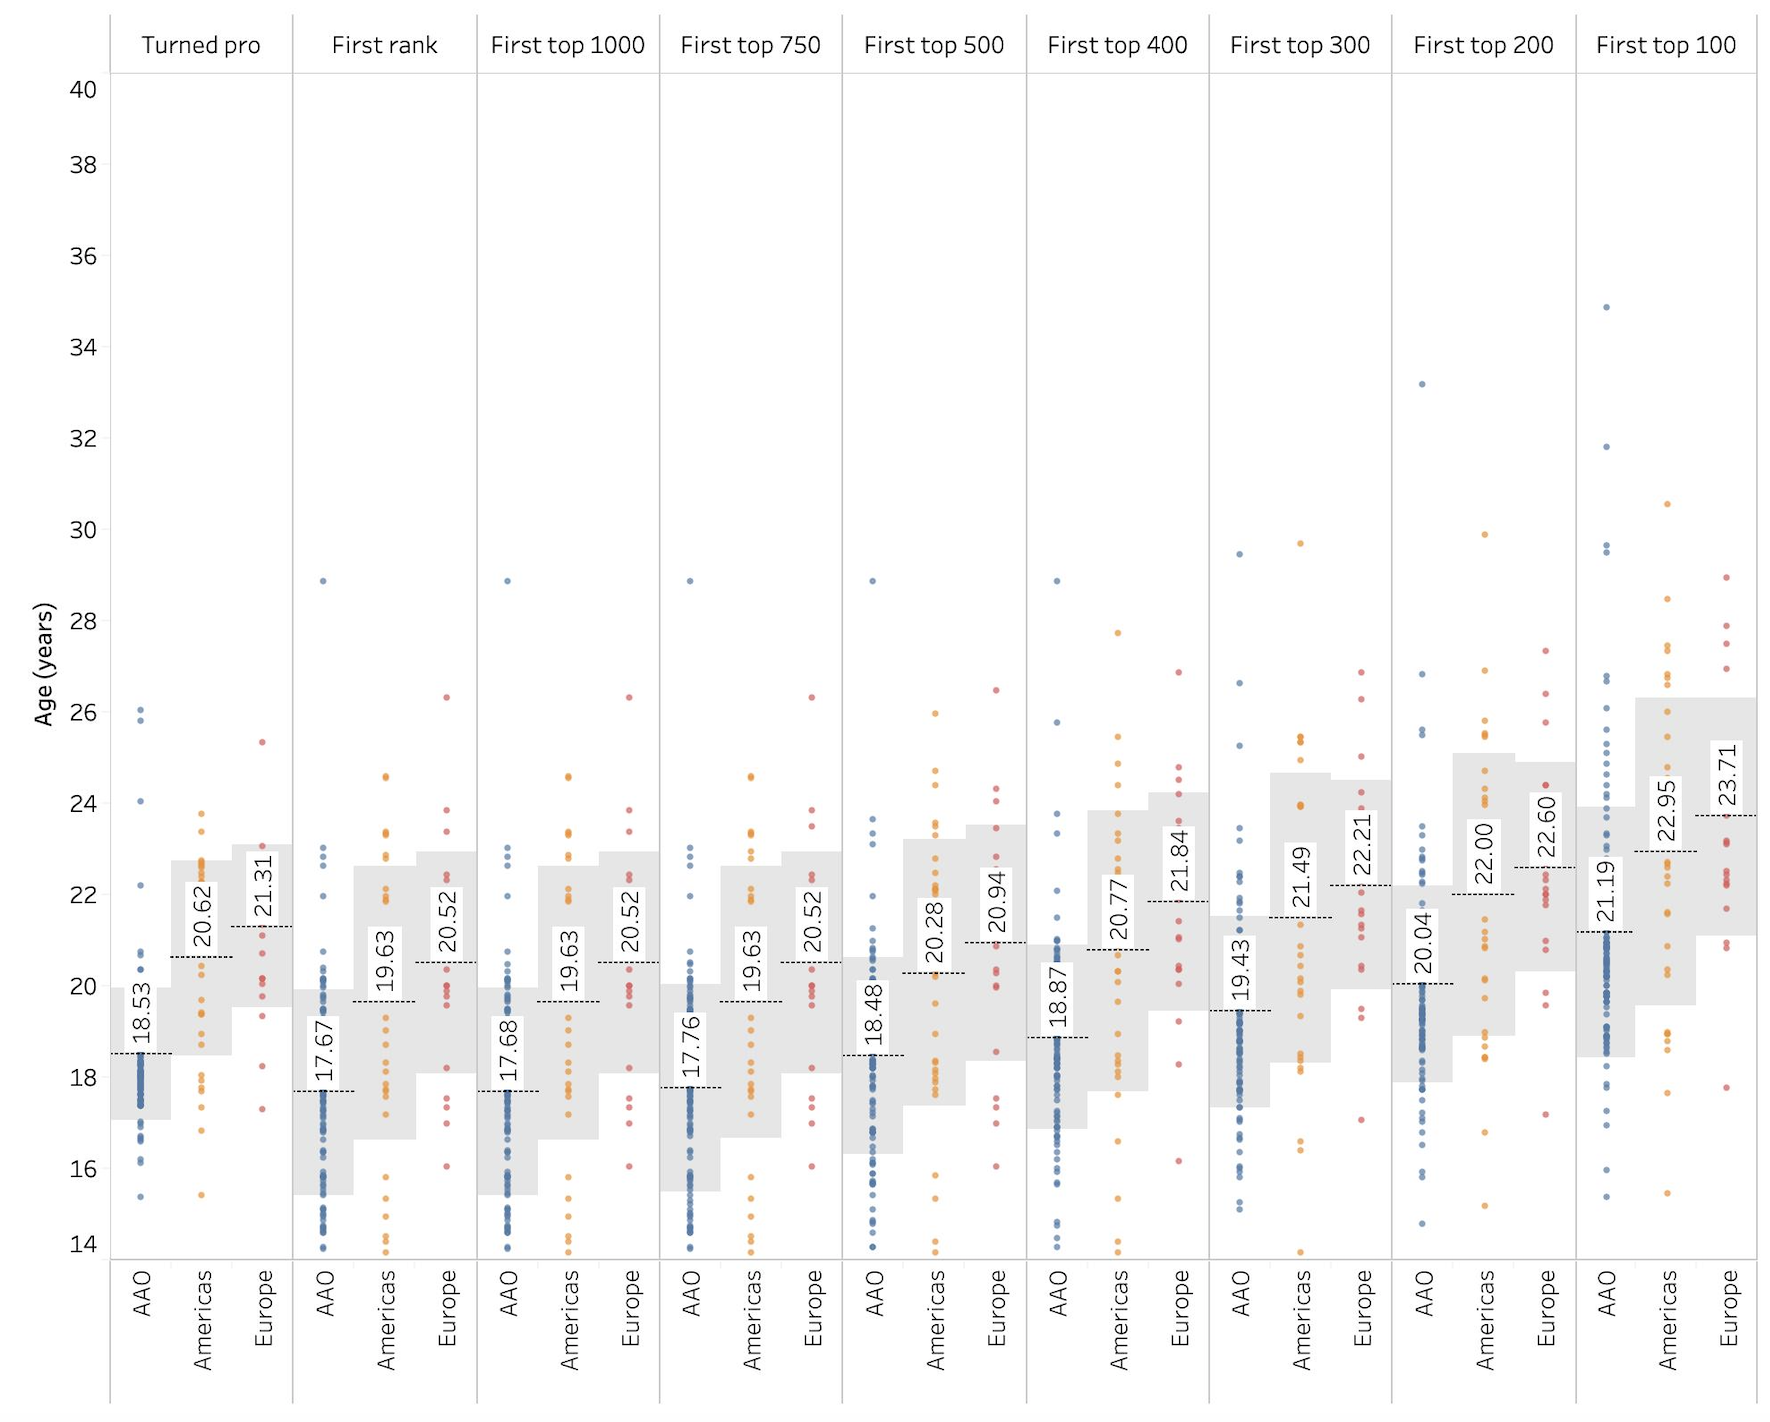
Figure 4 shows the mean ages female golfers from the three regional groups turned professional and reached ranking milestones (see supplementary table 3b for data on TTs and first absolute ranking). Like the males, golfers from AAO attained their first WWGR at significantly younger ages than golfers from the Americas and Europe. In contrast to the males, female golfers from Europe received a WWGR at older ages than those from the Americas, however this finding was not significant. Female golfers from all regions received their first WWGR before declaring professional status. As all groups declared professional about one-year after receiving their first WWGR, the same relationships and significant differences displayed at the first ranked milestone were upheld. Overall, golfers from AAO were first ranked and reached all ranking milestones at significantly younger ages than golfers from both the Americas and Europe. While Europeans were first ranked and reached ranking milestones at older ages than those from the Americas, these differences were not significant. Where significant differences in ranking milestones where found, measures of Partial η2 were large. Much like the male regional analysis, an inverse relationship was found between golfers’ age at first WWGR and total DT (Americas= 3.32 years, Europe= 3.20 years, AAO= 3.51 years). However, the absolute differences in DT between regions were minor and no significant differences were found. Like the male data, TTs were highly variable, and no significant differences were found at any individual TT across all groups. As the time taken to transition to the top 100 (i.e., DT) was similar between regions, the significant differences in the ages that golfers from regional groups reached ranking milestones could be attributed to the age differences at first WWGR.

Discussion
This study examined the ranking pathways of male and female top 100 ranked golfers. It also explored potential differences in ranking pathways due to gender and region. Overall, female golfers declared professional status and reached career ranking milestones at significantly younger ages and in less time than males. On average males received their first OWGR at around 22 years of age and reached the top 100 4.5 years later, whereas females received their first WWGR at roughly 18.5 years of age and reached the top 100 3.4 years later. For males, all regional groups were significantly different at age of first OWGR, with golfers from the Americas receiving their first OWGR at the oldest mean age, followed by the Europeans, and then those from AAO. Golfers from the Americas also reached all milestones at significantly older ages than those from Europe (excluding first top 100 ranking) and AAO. In terms of the relationship between European and AAO golfers, by the top 750 ranking milestone, golfers from these two regions no longer reached ranking milestones at significantly different ages. Groups who were first ranked at older ages also took less time to reach the top 100 (i.e., golfers from the Americas took the least amount of time, followed by Europeans, and then AAO golfers), however, this difference was only significant between golfers from the Americas and AAO. For females, golfers from AAO received their first WWGR and reached all milestones at significantly younger ages than golfers from the Americas and Europe. All female regional groups took a similar amount of time to transition from first WWGR to a top 100 ranking.
While male and female golfers followed diverse pathways to the top 100, the most notable differences in golfers’ ranking pathways occurred at early points in their careers. Close to 70% of female golfers received their first WWGR a year before declaring professional status. Females also entered the top 500 in the rankings before they were professionals. In comparison, only 37% of males received their first OWGR before declaring professional status and took an average of two years from turning professional to enter the top 500. These data show that females typically compete and place in professional events while classified as amateurs. Male top 100 golfers progress through the professional ranks later in their careers than females, yet it is likely they also compete in professional events as amateurs but to a lesser extent. Studies focusing on the influence of gender on athlete’s developmental pathways are relatively scarce (Coutinho et al., 2014). Of the limited work that exists, studies in tennis (Li et al., 2018, 2020) have compared the ranking pathways of male and female players and, like the results of the current study, females typically advanced through the ranks at younger ages and in less time than males (e.g., Li et al., 2020). Research in tennis also shows that elite junior female players focus on the professional game at earlier ages than males (Reid et al., 2009). Further, Gulbin et al. (2013) reported that simultaneous participation at the junior and senior level is an important feature of elite athletes’ developmental pathways. Simultaneous participation at the amateur and professional level may provide up-and-coming golfers with opportunities to prepare for the challenges of the professional circuit (Bruce et al., 2013; Reid et al., 2014). In turn, golfers participating and having success in professional golf tournaments as an amateur may be a prerequisite for future success at the professional level, especially for females. Future research is warranted to further explore the relationship between golfers’ amateur success and success at the professional level.
In professional golf, many sport system differences exist between genders. The OWGR and WWGR are administrated independently, each with their own distinct ranking systems and individual tours. Owing to the lack of uniformity in ranking systems, male golfers are generally afforded greater competition opportunities. For example, in 2019, 23 male professional tours offered OWGR points compared to just 10 for females. The gap in competition opportunities between genders may contribute to a greater depth of competition on the male side of the game. By looking at the participation data from 2019, evidence of this trend can be seen with ~700 more male professionals ranked than females. Indeed, depth of competition can influence the developmental pathways that athletes follow to the elite levels of performance (Baker & Horton, 2004). With fewer participants it is perhaps not surprising that gifted, top 100 females progress through the rankings in less time than males.
For male and female top 100 golfers, the TTs between ranking milestones signified relatively small portions of overall development. The only point in their careers where golfers took greater than one year to transition was the move from the top 200 to 100 in the rankings. While TTs between milestones are useful yardsticks for coaches and developing golfers, it is important to acknowledge the considerable variability that was present in the data. For instance, some golfers took just a week to transition from the top 200 to 100, while others took close to 10 years. Clearly, golfers follow many different pathways on their journey to the game’s top 100. This result provides support for the popular notion of athlete development as a dynamic, non-linear process (Gulbin, Weissensteiner, et al., 2013). The ages that golfers reached ranking milestones also displayed a high degree of variability, which could be attributed to the many competition streams available for professional golfers. For example, to qualify for the PGA Tour golfers may be required to play full seasons on developmental tours such as the Korn Ferry Tour to earn status. Other golfers may receive sponsors exceptions to compete in PGA Tour events as amateurs, which can provide direct entry to the tour the following season. Future research should seek to explore the various competition pathways that professional golfers encounter as they ascend the rankings.
Athletes from different geographic regions often experience unique developmental experiences and sporting systems (Baker & Horton, 2004; De Bosscher et al., 2003, 2008; Güllich, 2017). As outlined in our results, male and female golfers from different regions followed significantly different pathways to the top 100. A multitude of factors may contribute to regional differences in athletes’ career ranking pathways. The cultural importance of golf coupled with the economic welfare of discrete regions may lead to athletes having different experiences in terms of available training, coaching, and competition environments (Baker & Horton, 2004). For example, 93% of male top 100 ranked golfers from the Americas attended an NCAA golf program compared to just 19% of those from the AAO. To maintain NCAA eligibility, athletes must uphold their amateur status. From our data, the average age that golfers from the Americas turned professional was 22 years of age – the typical age of a student-athlete at end of a four-year undergraduate degree. In comparison, golfers from AAO often enter the professional ranks at earlier ages via regional tours. The differences in competition systems was also found to differentiate between the ranking pathways of American and Spanish top 100 ranked male tennis players (Reid & Morris, 2013). In that study, 75% of top 100 ranked Spanish players held an ATP ranking at the age of 17 compared to just 45% of Americans.
Socio-cultural factors such as social norms and gender roles may also contribute to regional differences. One example can be seen in South Korea, where females are afforded greater opportunities than males to adopt an ‘all-in’ approach to pursue a career in professional golf (Shin & Nam, 2004; Sung et al., 2018). This may explain why female golfers from the AAO region turned professional at significantly younger ages than golfers from both other regions. Furthermore, the high cultural importance placed upon golf may contribute to the disproportionate number of top 100 female golfers produced by South Korea compared to other countries in the AAO as well as the Americas and Europe. In these other regions, various social norms and values may deem other sports more enticing for females to pursue rather than a career in professional golf (Reid, Crespo, Santilli, et al., 2007). Results of the female sample should be interpreted cautiously, as golfers from the AAO (specifically South Koreans) are overrepresented.
Practically, the findings of this study provide sport-specific data to support golf AD models. For example, applying the current data to the FTEM framework could enable stakeholders to define benchmarks that outline the transition from the amateur game to success at the professional level. More specifically, the T4 stage of the FTEM encompasses the beginning of the transition from amateur to professional competition to when an athlete begins playing at a top professional level (e.g., PGA/European Tour) (Gulbin, Croser, et al., 2013). Based on the current data, the T4 stage would typically commence around the age of 21-22 and 19-20 years of age, for males and females respectively and continue throughout the early professional ranking benchmarks (i.e., top 1000, 750, 500).
As previously highlighted, the timing of benchmarks differs between regions, and development models should be adjusted accordingly. From a developmental standpoint, statistical data can help inform decisions regarding career planning (Reid et al., 2014). For instance, aspiring American male golfers may choose to play in the NCAA because data show it is a viable pathway to professional success. American female golfers, on the other hand, may follow an accelerated pathway to the professional game at younger ages, forgoing the NCAA pathway.
Various developmental resources (e.g., coaching, sports science and sports medicine, competition opportunities, etc.) contribute to the development of elite performers (Baker & Horton, 2004; De Bosscher et al., 2015; Stambulova et al., 2017). However, data from the current study reflect the effect and not the cause of the ranking pathways. Further quantitative and qualitative research is required to understand the resources that support golfers transition between stages within a golf-specific AD model. Nevertheless, due to the scarce number of invstigations regarding AD in golf, the current data provides an important starting point that begins to outline the stages of golf development from the elite amateur to top professional levels of competition.
In terms of athlete selections, player progression along the ranking pathway can be tracked by using ranking benchmarks. Benchmarks allow for the pathways of currently developing players to be mapped agains previous data. Coupled with other quantitative data and the qualitative insights of coaches, rankings data may be a helpful tool to aid with athlete investment decisions (Reid et al., 2014).
A potential limitation of this study was that some of the regional groups included countries with diverse socio-cultural environments (e.g., Australia, South Korea, and Africa for the AAO group). This was done to produce a meaningful sample size as well as to group countries with similar golf systems and tours. Yet the intra-regional variability present in the data suggests that a country-level comparison may be a valuable avenue for future research. In terms of methodology, the use of discrete ranking milestones to track top 100 golfers’ career pathways meant it was difficult to account for the “noise” or non-linearity in the data. Additionally, while these analyses offer a rich description of the ranking pathways world class golfers follow, they do not provide data to discriminate between those that reach the top 100 and those who do not. Previous work in tennis has examined whether the ranking trajectories of tennis players who reached different peak rankings were distinguishable from one another (Kovalchik et al., 2017; Reid et al., 2014). It was revealed that the ranking trajectories of players who reached better peak rankings were distinguishable from early in the player’s careers. Future work in this area should seek to determine whether ranking pathways can be used to discriminate between professional golfers of different skill levels. Such data may be an increasingly useful tool when selecting athletes who have the most potential for future professional success.
Conclusion
The results of the current study offer a descriptive overview of the ranking pathways that male and female professional golfers take to a top 100 world ranking. Overall, significant differences in the ranking pathways of male and female golfers and those from different geographic regions were found. Such data may be used as yardsticks for goal setting and to make decisions on whether to proceed or discontinue funding a costly career in the sport. It is generally accepted that AD is a non-linear and unpredictable process, and as such, measurement variables related to AD will likely have a high degree of variability (Gulbin, Weissensteiner, et al., 2013). However, using objective data, rather than relying solely on subjective knowledge, can improve the effectiveness and accuracy of development and selection decisions (Hartigh et al., 2018). While the data in this study is highly variable, it can still be useful for golf NSOs looking to optimize the objective data available to them, in order to minimize decision-making errors (Johnston & Baker, 2020). It is worth noting that this study only provides a piece of the ‘data solution’ puzzle for decision-making in golf, and golf NSOs should complement the current data with their own data and results from future studies on AID in golf to make the most accurate decisions possible. Collectively, the current findings highlight the need for stakeholders and decision-makers to remain cognisant of gender and regional differences when using objective data to inform AID programs in golf and other sporting disciplines.
Acknowledgments
The authors would like to thank the Official World Golf Ranking for their ongoing assistance as well as their provision of data relating to this project.
Disclosure statement
The authors report no conflict of interest.