


Introduction
Professional athletes are incredibly talented and motivated individuals who work tirelessly toward the goal of excellence in their given sport. The amount of skill and dedication it takes to make it to the highest level of a sport is often difficult for amateurs and non-athletes to fathom. Among elite athletes, the difference between qualifying, advancing, and winning or losing is often small. Thus, top athletes constantly seek to gain small advantages through skill maintenance and improvements as they are often evenly matched with the slightest mistake or favorable situation being the difference between success and failure.
Golf professionals on the PGA Tour are no exception. The ability to qualify for a tournament, make the cut, or finish near the top of the leaderboard often hinges on the slightest statistical edge over other competitors. For example, in our dataset, 33% of tournaments were won by a single stroke, and 22% required a playoff after players tied at the end of regulation. While much of the difference in performance on a day-to-day, week-to-week, and season-to-season period comes down to pure ability coupled with luck, another factor that impacts performance may also play a key role. This factor is the weather as it influences players’ decision-making process (Nicholls & Polman, 2008) and tournament performance (Stöckl & Lamb, 2018).
Professional athletes recognize that their hard work, mental development, skill acquisition, and decision-making do not guarantee a successful career, since uncertain or unfortunate situations can be attributed to luck (Augestad et al., 2021). Elite players, however, would rather create their own luck than rely solely on good fortune. By accounting for more external factors that influence their performance, the outcome of their performance can become less dependent on luck. For example, calibrating expected driver performance or adjusting yardage books prior to a round allows players and caddies to integrate atmospheric conditions into shot planning. These practices support more deliberate preparation, help mitigate outcome variability, and lead to more informed expectations of performance (Augestad et al., 2021).
Since professional golf tournaments are typically held outdoors, golfers are exposed to the elements. Whether it is precipitation, wind, temperature or other factors, weather is a major challenge to golfers of all ages and abilities. In nearly all cases, weather conditions change frequently from week-to-week, during a tournament, daily, and even during a round. Players perceive weather conditions as stressors (Nicholls & Polman, 2008) and naturally react to those uncontrollable constraints (Stöckl & Lamb, 2018). Players facing more challenging weather conditions often post higher scores with extended decision-making time, leading to key differences in making the cut, position of finish, or even winning a tournament.
Professional athletes in outdoor sports often face environmental conditions that significantly impact their routines (Nicholls & Polman, 2008), physical fatigue (Kaliński, 2020), and performance outcomes (Stöckl & Lamb, 2018). Their playing experiences in rain, wind, cold, and hot conditions may impact their preferences of atmospheric conditions. Professional athletes, despite the preference or weather conditions, consistently strive for consistent performance results. Having a concrete plan for the game empowers players to effectively manage stressors (Roth & Cohen, 1986), enabling them to handle uncertain outcomes effectively on the course. By deliberating and preparing based on atmospheric condition data, players can better cope with these uncertain situations. This preparation leads to increased commitment levels for each shot, reduced anxiety and hesitation, and ultimately, more opportunities for capitalization.
Jowett and Phillips (2023) analyzed the effects of weather on golf scores at the Masters Tournament held at Augusta National in Augusta, Georgia. While this study makes great strides in isolating the effects of various weather conditions on performance, it has limitations. One limitation is that it only studies one tournament, played at the same location over the sample period studied. Another is that it only uses daily weather figures to estimate its impact on golfer performance. In this study, we build upon Jowett and Phillips (2023) by expanding the sample to include all PGA tournament events. We also adopt a more micro-level approach to weather analysis by directly measuring conditions during each golfer’s specific playing time, utilizing their tee times as a reference point.
Beyond the adjustments made to increase the sample to all tournaments and focusing the weather to the specific player-round, we also add to the weather-related variables studied by focusing on the physics of ball movement from studies of baseball. Bahill, et al. (2009) were able to isolate the factors that impact how far a baseball will travel using air density. We use air density and its individual components, along with variables related to wind, dew point, and temperature, to estimate their impact on key measures of golf performance—specifically, total strokes and driving distance as they relate to tournament standings.
Using regression models, we estimate and describe the effects of various variables on the performance of professional golfers on the PGA tour. By better understanding these variables, we can potentially reduce the perceived “luck” that is often used to explain the disparity between planned outcomes and actual results. These results have major implications for PGA tour performance and rankings but also have implications for golfers of all ages and abilities, as weather is a major factor in their scores as well. Findings will not only reduce a gap in the existing literature regarding the effects of atmospheric conditions on sports performance but also strengthen the literature regarding instructional methods such as course management, mental practices, and distance control based on spin rates. The paper is organized as follows. The background literature is discussed in the second section. The third section covers the methods used, while the fourth section presents and describes the tables and charts of results. The last section discusses the findings and concludes the paper.
Background Literature
Golf is inherently an outdoor sport, and weather conditions naturally influence performance. However, the role of weather is often overlooked in golf-related research. For instance, Ehrenberg and Bognanno (1990) found that tournament prize money significantly influenced player performance. Yet, their analysis did not include for weather covariates. In a follow-up study, Orszag (1994) re-examined this relationship and found that the effect of prize money on performance became statistically insignificant once weather data were included. Orszag attributed this discrepancy to the omission of weather variables, highlighting the importance of accounting for atmospheric conditions in studies of golf performance.
Jowett and Phillips (2023) released the first and only known study analyzing the effect of weather on golf scores in professional golf, focusing specifically on the Masters Tournament. Other studies, like Baugher et al. (2016) and Bliss (2021), investigated performance by looking at certain skills like driving, putting, and chipping. However, as Stigler and Stigler (2018) pointed out, the golfers playing at the highest level all contain a great degree of skill and there is a reasonable amount of luck that impacts the differences in performance amongst golfers at a given event. Some of this luck may be based on weather conditions during the time at which one golfer is playing compared to the next.
In terms of the impact of weather on sports beyond golf, a key study by Bahill et al. (2009), published in the International Journal of Sports Science and Engineering, examined the flight of a baseball. Using principles of physics, the authors demonstrated that the distance a baseball travels is influenced by air density. Air density is determined by four main factors: altitude, temperature, humidity, and barometric pressure. While barometric pressure is positively associated with air density, the other three factors have inverse relationships.
The key takeaways from Bahill, et al. (2009) showed that altitude has the largest effect on air density, followed, in order, by temperature, barometric pressure, and humidity. Air density affects the distance an object, such as a baseball, travels through its interaction with two countervailing forces, drag force and magnus force. In the case of lower air density, drag force decreases, which allows the ball to travel a greater distance. However, magnus force also decreases with lower air density which impacts how long the ball will stay in the air, which decreases the distance it will travel. The study revealed that drag force tends to dominate magnus force, which leads to a baseball traveling farther when air density is lower. Simulations revealed a 4% increase in the distance a baseball travels with a 10% decrease in air density. Although this study focused on baseball, other objects, such as the flight of a golf ball, are also subjected to the same rules of physics.
Driving distance is an important performance measure to investigate, as it makes up a sizable portion of the total distance the ball travels in many holes and of a golfer’s overall skillset. Baugher et al. (2016) provide strong evidence for this, showing that since 2011, driving distance has become the most important predictor of PGA Tour earnings—surpassing even putting. They attribute this shift in part to increasing course lengths on Tour, which place a premium on long tee shots. These findings challenge the traditional adage “drive for show, putt for dough,” and underscore the relevance of examining driving distance in professional golf.
Methods
Our dataset spans seven PGA Tour seasons and was sourced from DataGolf.com, which provides strokes-per-round data from the PGA Tour (Datagolf.Com FAQ, 2024). To ensure we analyzed only the most elite professional fields, we excluded any charity events, such as the Pebble Beach Pro-Am, which often features celebrities and is not attended by many of the top professional golfers (Beall, 2024). We also removed any events that lasted five days instead of four due to weather delays, as this often results in some rounds spanning two days. Our data only included initial tee times and did not account for rounds that were restarted. To control for variation in course difficulty across tournaments, we included course yardage as a continuous predictor and incorporated course par as a categorical fixed effect.
The weather data came from Weather Underground (Weather Underground, 2025). We matched weather data to golf performance at the round and tee-time level. Using average times per hole (Ryan, 2023), we estimated the typical duration of play for par-70 through par-73 courses, based on the 2023 PGA Tour setup (Ehrlich & Kamimoto, 2024). Using these average durations, we estimate the duration for a player’s given round and aggregate weather data based on the starting tee time and estimated duration. For example, we estimate that a par-72 course takes 274.02 minutes to complete on average. If a golfer’s tee time is 10:00 a.m., then we aggregated weather between 10:00 a.m. and 2:34:02 p.m. We also include precipitation data for 24 hours before the start of the round, since rain before a round can affect course conditions. For each round-tee time for an event, we subset weather timestamps for the location of the event that occur during this time frame.
A weighted average was used for temperature, dew point, wind speed, wind gust, pressure, and humidity as timestamps are not always consistent. The weighted average was based on the proportion of time covered by a timestamp within the round time frame. For precipitation during a round and 24 hours before a round, we summed the precipitation recorded from the timestamps within the time frame. If the beginning and end of the 24-hour time period before a round and the time period during the round were in between weather timestamps, we reduced the precipitation by the proportion of time that was covered in the 24 hours. That is, if a golfer’s tee time was 10:00 a.m. and weather timestamps were present at 9:30 a.m. and 10:30 a.m. with 0.1 inches of precipitation recorded at 10:30 a.m., then the summed precipitation during that time period was recorded as 0.05 inches to estimate the amount of precipitation that fell since the beginning of the golfer’s round. We then summed the precipitation 24 hours before the round with the precipitation during the round to capture the total effect of precipitation on course conditions, as rainfall prior to the round can soften fairways and greens, affecting ball roll and playability, while rainfall during the round impacts player performance and decision-making.
An example of weather data during a golfer’s round is provided in Table 1. The table presents the weather recorded during a 1:10 p.m. tee time on 4/7/2018 in Augusta, Georgia, the third round of the Masters Tournament, which had an estimated round duration of 274.02 minutes (Augusta, GA Weather History | Weather Underground, 2023). To weight the recorded weather for each timestamp, we calculated the time covered for the timestamps. For the first timestamp, the “before minutes” are simply the number of minutes elapsed between the tee time and the first timestamp, while for the last timestamp, the “after minutes” are the number of minutes elapsed between the last timestamp and the estimated end of the round. The remaining before and after minutes are the difference in minutes between two adjacent timestamps divided by two, such that the difference in minutes between timestamps is shared proportionally. Lastly, the before and after minutes for each timestamp are summed, and a weighted average is applied for temperature, dew point, wind speed, wind gust, pressure, and humidity. The precipitation during this round is recorded as 0.525 inches as the first timestamp is reduced by 3/4. The previous timestamp was recorded at 1:07 p.m., which indicates that 0.1 inches of rain were recorded between 1:07 and 1:11 p.m. With the round starting at 1:10 p.m., the round occurs in ¼ of this time period, so 0.025 inches of precipitation are attributed to the time period. The same methodology is applied to the prior 24 hours but is not displayed for conciseness.
Table 2 displays summary statistics for the dependent variables used in the models as well as weather measurements and round details. Total strokes are distributed around a mean of 70.804, such that the best round for any golfer in the data shoots an astonishing 59, while the worst shoots 92. The average distance on drives across the dataset is just under 290 yards. Some events do not include average driving distance data because they are not administered by the PGA TOUR, even though they are considered official PGA TOUR events. These include majors such as the Masters, the U.S. Open, and The Open Championship. Our weather variables show that at golf events, conditions can vary due to differences in location, time of year, time of day, and elevation. The average tee-time start at events is roughly 10:30 a.m. local time. As each round progresses, fewer observations are recorded for two primary reasons. First, the majority of professional golf events with the stroke play format tend to cut the field after the first two rounds of play based on performance up to that point. Secondly, some golfers will retire throughout the course of an event due to injury or other circumstances, which further reduces the number of participants in an event. The number of observations across each year is close to a uniform distribution, with the lowest percentage coming from 2020, caused by the COVID-19 pandemic. The relationships among the weather variables are presented in Figure 1 as a correlation matrix, displaying only correlations significant at a p-value of 0.05 or lower.

We have estimated two sets of models using two different dependent variables, which are presented in equation 1 and 3. In our initial set of models, the dependent variable is total strokes per round, which measures the number of strokes a given player takes in a single round. This approach allows us to analyze the effect of weather conditions on overall performance. The first model serves as a baseline, estimating round scores based on player, season, and round. The formula for the total strokes model is presented in Equation 1. Dew point was removed due to multicollinearity issues, as its variance inflation factor (VIF) was found to be equal to 16.989.
Equation 1: Air Density Component Model Equation
Yi,j,k=β0+ β1Elevationk+ β2Tempi,j,k+ β3Humi,j,k+ β4Bar Pressurei,j,k+ β5Wind Speedi,j,k+ β6Wind Gusti,j,k+ β7Precipi,j,k+ ϵi,j,k
Where:
is the outcome of interest for player i in round j of event k.
is the elevation in meters at the event k.
represents the average temperature, in degrees Fahrenheit, during player i’s jth round at event k.
represents the average humidity, in percentage, during player i’s jth round at event k.
represents the average barometric pressure, in inches of mercury, during player i’s jth round at event k.
represents the average wind speed, in miles per hour, during player i’s jth round at event k.
represents the average wind gust, in miles per hour, during player i’s jth round at event k.
represents the total precipitation, in inches, during player i’s jth round at event k.
The formula for air density, originally derived by Terry Bahill et al. (2009) in their paper on the effects of weather on baseball, is presented in Equation 2.
Equation 2: Air Density
Air Density=1.045+0.01045 (−0.0035 (Elevation−2600)−0.2422(Temp−85)−0.0480 (Hum−50)+3.4223 (Bar Pressure−29.92))
To isolate the effect of air density, we formulated a model excluding its components—elevation, temperature, humidity, and barometric pressure. This formula calculates density in kg/m3, which we convert to lb/ft3 by multiplying by 0.0625 to ensure consistency with the other parameters. Unlike in the first model, dew point is included here because there are no issues with multicollinearity, as indicated by its VIF score of 1.097.
Equation 3: Air Density Model Equation
Yi,j,k=β0+ β1Air Densityi,j,k+β2Dew Pnti,j,k+ β3Wind Speedi,j,k+ β4Wind Gusti,j,k+ β5Precipi,j,k+ ϵi,j,k
Where:
is the outcome of interest for player i in round j of event k.
represents the average air density, in pounds per cubic foot, during player i’s jth round at event k.
represents the average temperature, in degrees Fahrenheit, during player i’s jth round at event k.
represents the average wind speed, in miles per hour, during player i’s jth round at event k.
represents the average wind gust, in miles per hour, during player i’s jth round at event k.
represents the total precipitation, in inches, during player i’s jth round at event k.
For our dependent variable in our second set of models, we chose driving distance, which is a measure of both ball carry (in the air) and the distance the ball rolls out on the ground. The driving distance recorded by the PGA Tour is the average of the two measured drives of opposite directions per round, which are strategically chosen to be opposite in direction and as parallel as possible to minimize the impact of wind (Fairholm, 2024). Equation 1 is the basis the model that contains the density components, and equation 3 is the equation for the model with density instead of the components. Similar to the total strokes model, dew point is included only in the third model due to multicollinearity issues in the second model (VIF score = 17.468), which are resolved in the second model (VIF score = 1.109). However, unlike the total strokes model, air pressure also had multicollinearity issues in the first model (VIF score = 13.753), therefore this was removed.
All models include fixed effects for player, season, and round number. The player fixed effects control for performance differences between golfers, the season fixed effects account for performance variations across PGA Tour seasons, and the round number fixed effects control for differences between rounds, including changes in field composition after the second-round cut.
Results
The results from the initial models displayed in Table 3 suggest that the weather variables included have a considerable and statistically significant (p < 0.001) impact on total strokes for golfers. The first model, with an R2 of 0.154, is the base model, without any weather data, which allows the comparison between models that include weather and one that does not. In the second specification, with an R2 of 0.208, the elevation, average temperature, average humidity, and the sum of precipitation variables are significant with negative estimates showing that greater measurements of these variables lead to lower strokes. Average pressure, wind speed, and wind gust are significant variables with positive estimates, suggesting the opposite. The increase in R2 from 0.154 to 0.208 represents a 35% relative increase in explanatory power, underscoring the added value of including weather conditions.
In the third specification, elevation, average temperature, average humidity, and average pressure are replaced with air density and average dew point. Many of the same relationships hold: average wind speed and wind gusts remain significant positive predictors of total strokes, while the sum of precipitation remains a significant negative predictor. The primary variable of interest, air density, is significant with a positive coefficient, and average dew point is also significant but negative. Substituting air density for the individual weather components, and including average dew point, results in a slight reduction in explanatory power, with R² decreasing from 0.208 (full weather model) to 0.199. Despite this modest decline, the model still explains substantially more variance than the baseline specification (R² = 0.154). Specifically, using only air density and average dew point increases explanatory power by 29.2% relative to the base model, compared with a 35.1% improvement when using the full set of weather variables. This suggests that while air density and average dew point effectively capture much of the relevant information, the disaggregated air density weather variables related to air density provide slightly greater explanatory precision.
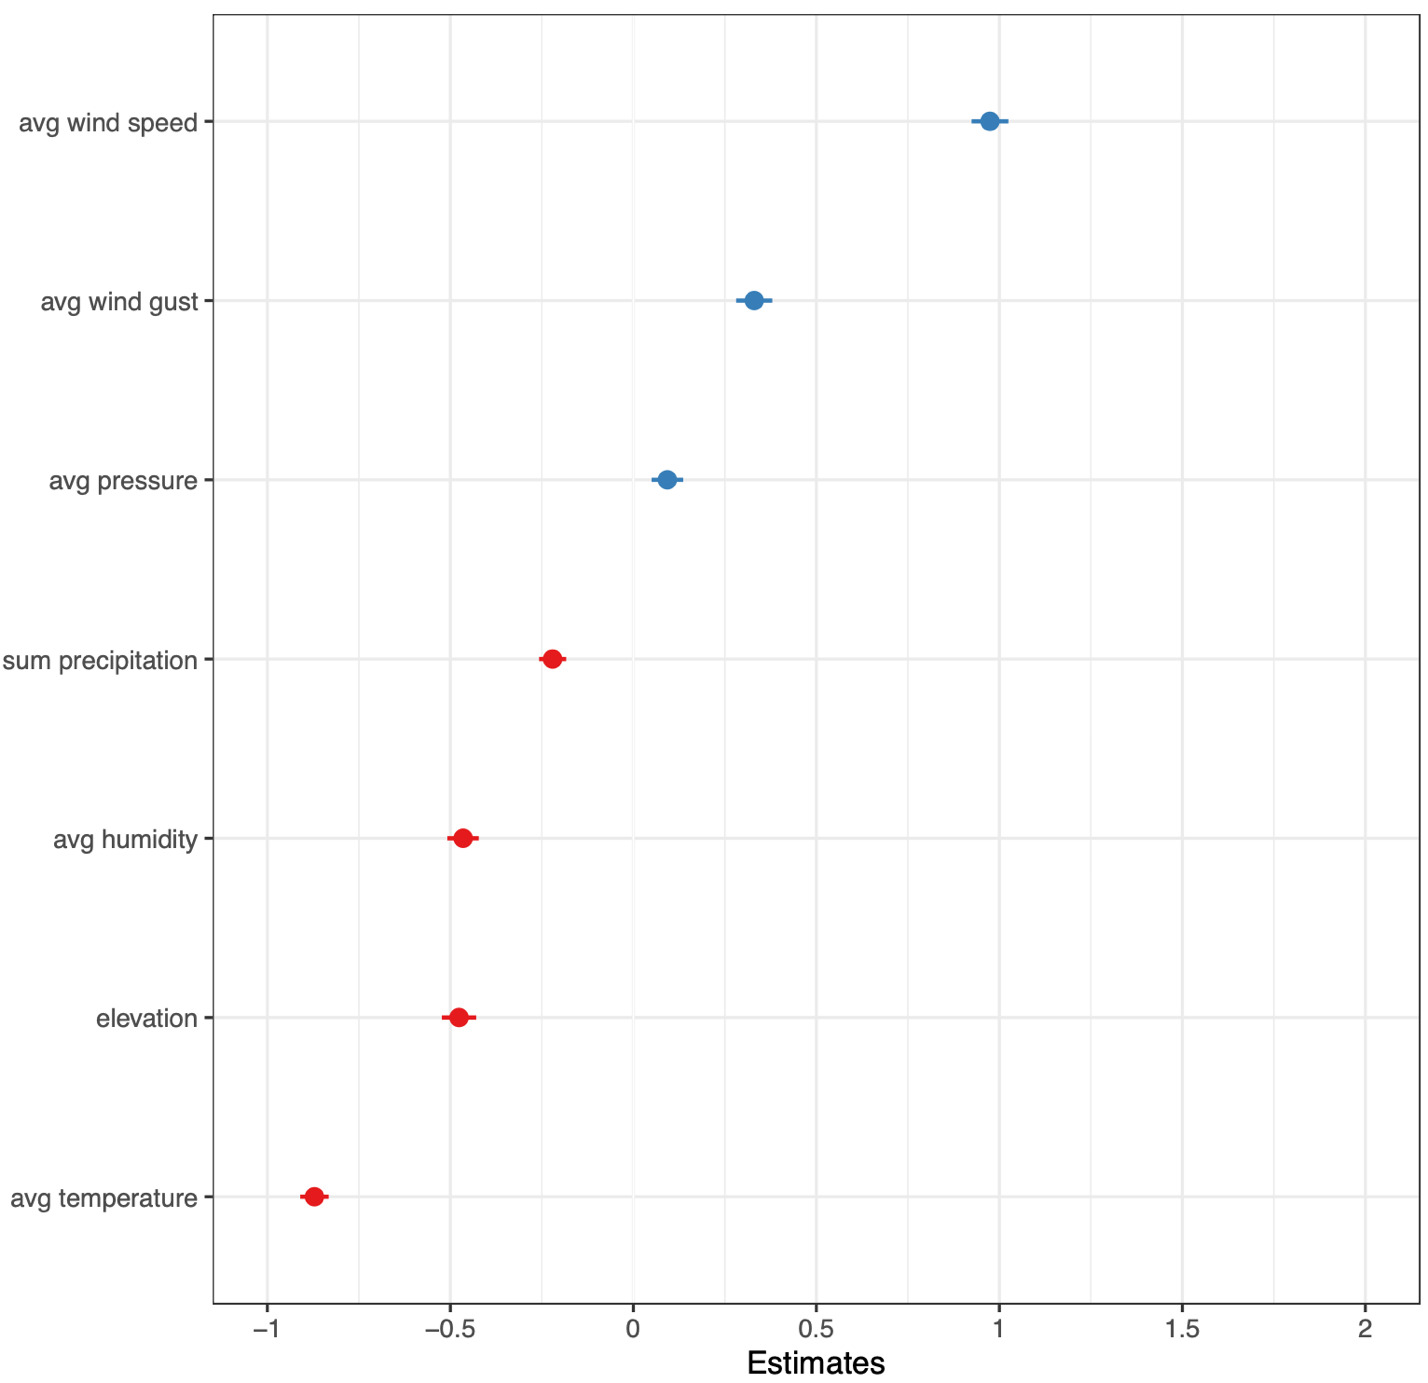
The marginal effects of the eight independent variables in Table 3 are displayed in the plots in Figure 2a. These coefficients are standardized in Figure 2b, and all standardized coefficients presented in this paper follow Gelman’s method (Gelman, 2008). This approach refits the model using predictors scaled by two standard deviations, ensuring that the magnitude of the coefficients is directly comparable across variables (Lüdecke, 2024). The dependent variable remains in its original units (strokes). Reported coefficients therefore reflect the expected change in total strokes for a two-standard-deviation increase in each predictor. The greatest potential for gaining strokes by varying conditions is that of average temperature, which suggests that extremely hot temperatures present opportunities for greater performance. Although statistically robust, the magnitude of this estimate (approximately one stroke for every 20°F drop in temperature) should be interpreted with caution, as it may still capture residual round-level variation not fully accounted for by our player fixed effects or weather covariates. Elevation, average humidity, and the sum of precipitation also have positive effects. The remaining variables show negative marginal effects with increases in their measurements.


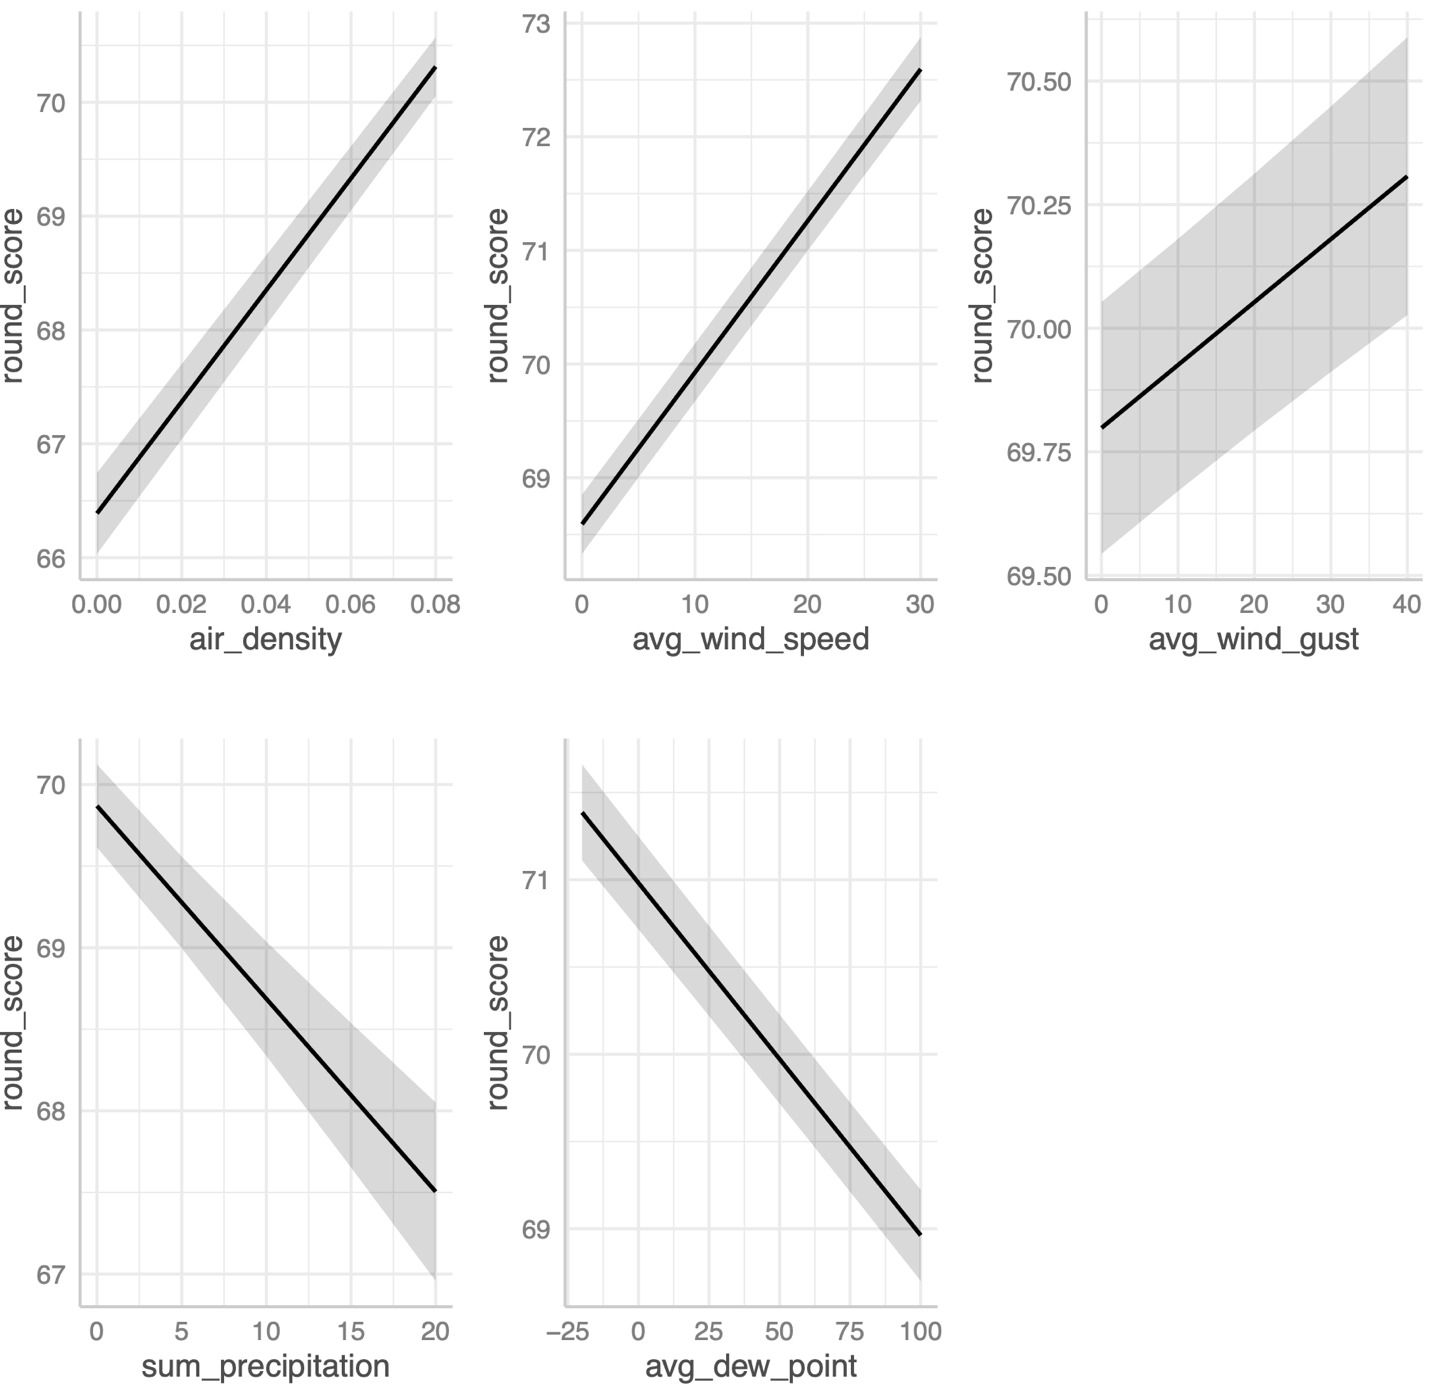
Figure 3a displays the marginal effects of the five variables included in the model with air density on total strokes, while Figure 3b presents the standardized coefficients for this model. Compared to the other four variables, average wind speed displays the greatest variance in the marginal effect on total strokes where an increase of two standard deviations (8.60 mph) is associated with 1.15 additional strokes. Air density also has a large, positive marginal effect on total strokes such that two additional standard deviations (0.01 lb/ft3) of density increases total strokes by 0.53 strokes per round. The plot for average dew point shows the potential of decreasing strokes when dew point is high. Average wind gust shows a moderate positive effect on total strokes, while the sum of precipitation has a moderate negative effect.


Turning to driving distance as the dependent variable, weather predictors account for a substantial portion of the variance. As shown in Table 4, the baseline model without weather variables yields an R² of 0.398. In comparison, the full weather model includes elevation and average temperature, which are both positively associated with driving distance, as well as average humidity, wind speed, wind gusts, and sum of precipitation, which are each negatively associated. This specification achieves an R² of 0.513, representing a 28.9% relative increase in explanatory power and underscoring the importance of weather conditions in driving performance.
In the third specification, elevation, average temperature, and average humidity are replaced with a composite air density measure and average dew point. All five weather-related variables are statistically significant with negative coefficients. This model achieves an R² of 0.502, slightly below the full weather model (R² = 0.513), but still well above the baseline model (R² = 0.398). This represents a 26.1% relative increase in explanatory power compared to the base model, suggesting that while air density and average dew point capture much of the relevant variation, the disaggregated weather variables offer marginally better predictive performance.
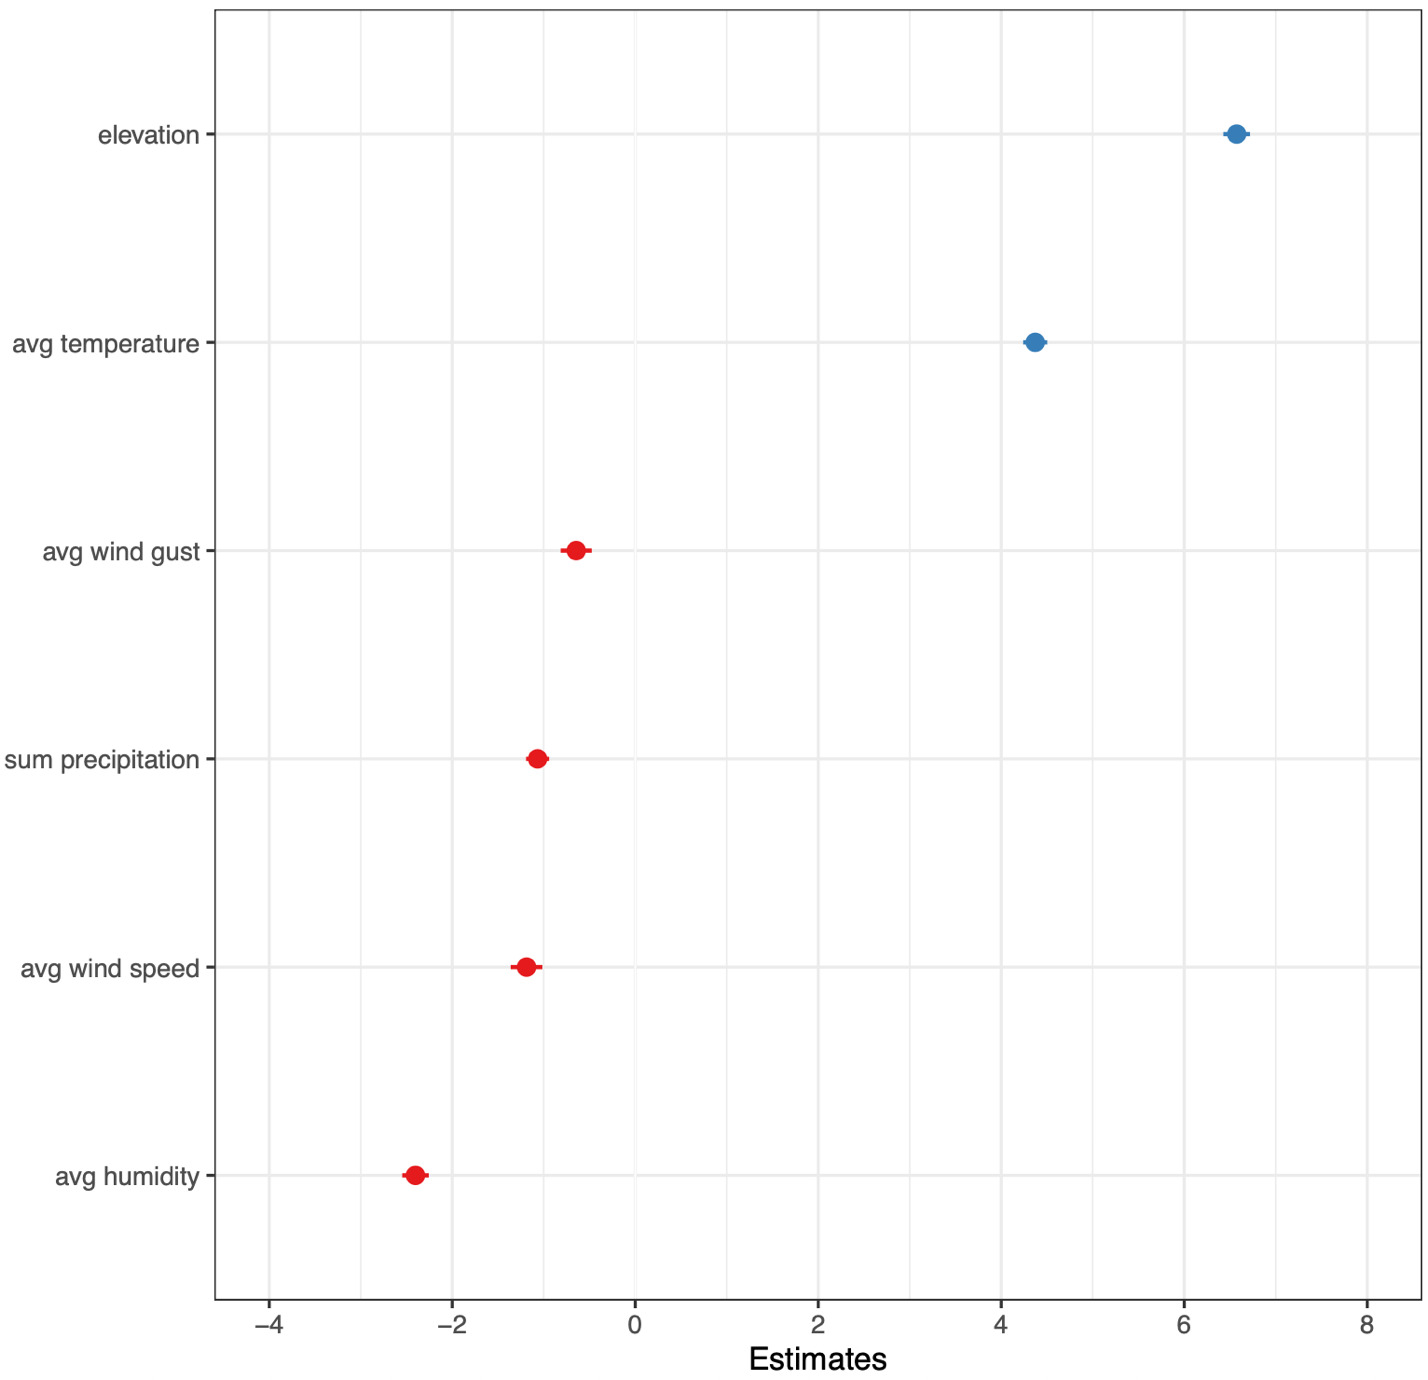
Figure 4a displays the marginal effects for the model incorporating elevation, average temperature, average humidity, and average pressure instead of air density, while Figure 4b presents the corresponding standardized coefficients. Elevation gain shows a large positive effect on driving distance, as does higher average temperature. For context, the model suggests that hitting a shot in Reno (5,280 feet above sea level) rather than at sea level would increase total driving distance by approximately 15 yards. By comparison, a two-standard-deviation increase in elevation (2,361 feet) is associated with an estimated 7-yard increase. Average humidity has a considerable negative effect on driving distance, while the remaining variables exhibit relatively modest negative effects within their measurement ranges.


Figure 5a displays the marginal effects for the model incorporating density instead of its components, while Figure 5b presents the standardized coefficients for this model. We find that a 2 SD increase in air density (0.01 lb/ft3) may decrease the average driving distance by approximately 9 yards, while a 2 SD (28°F) increase in dew point can decrease driving distance by approximately 3 yards. A decrease of 0.012 lb/ft3 in air density is approximately the same as driving a ball in Reno (5,280 ft) instead of Los Angeles (0 ft), and we find that a Tour professional would extend his drive by approximately 16 yards using our density model.
To compare our results with other studies, we found that Titleist Golf Ball R&D, using a different approach (Veitch, 2019), estimates that a player would extend his drive by 6% hitting at Reno instead of at sea level, and so an average Tour player hitting 290 yards at sea level would extend his drive by 17.4 yards.
Similarly, Bahill et al. (2009) report that a 10% decrease in air density leads to a 4% increase in the distance a baseball travels. To compare, we simulated a 10% reduction in air density for each player-round in our data. We found that when using this reduced air density, the model’s estimated distance for each round increased by an average of 3.14% compared to the estimated distance using the original air density.
This slightly smaller percentage in golf can be attributed to two key factors. First, golf balls are more aerodynamically efficient – due to the dimpled surface and smaller size. Second, while the 4% increase in the baseball study reflects carry distance, our 3.14% increase affects total driving distance, which includes both carry and roll. Since roll is determined by ground conditions that are largely unaffected by air density, the overall gain in total distance is dampened relative to the effect on carry alone.
In all models, par fixed effects were added with par 70 as the reference. The estimated coefficients for these fixed effects do not exhibit a monotonic pattern, reflecting unobserved course design features and the fact that par and yardage are not perfectly collinear. The continuous yardage covariate is positive and significant in both the total-strokes and drivingdistance models, likely because longer courses both require longer drives and typically involve more strokes to complete a hole.


Discussion
The results presented in Tables 3 and 4 reveal that all weather variables considered as independent variables have a statistically significant impact on both total strokes and driving distance. Golfers tend to record fewer strokes when precipitation, elevation, humidity, dew point, and temperature are higher. Conversely, higher barometric pressure, wind speed, wind gusts, and air density are associated with increased stroke totals. Driving distance, on the other hand, tends to increase with greater elevation and temperature, while it tends to decrease with higher wind gusts, wind speed, precipitation, humidity, dew point, and air density.
By combining driving distance and total strokes models, we can gain insights into the factors influencing a golfer’s performance. Similar to Bahill et al.'s baseball study (2009), drag force surpasses the Magnus force on a golf ball, leading to an average increase of 3.14% total driving distance when air density is 10% lower. Increasing the carry distance allows golfers to reach the green in fewer strokes on average. This is because shorter distances tend to have less variability in shot outcomes, making it easier to hit the green consistently (Broadie, 2012).
The wind may affect a golfer’s ability to gain strokes by having unpredictable movements due to the ball spin rates and influencing the distance the ball travels in every direction. Wind can influence every aspect of the game, even during putting, as evidenced by Suzuki et al.'s (2025) experimental study, which demonstrated that wind can lead to distance errors during putting. Attempting to understand the effects that weather conditions have on driving distance is a simpler exercise. Like the effect on total strokes, higher winds, unless at the golfer’s back, can reduce the distance of a golfer’s drive by causing lateral movement which takes away from distance gained in the forward direction. Furthermore, this lateral movement may cause the ball to drift out of the fairway reducing the roll out that the ball may get after it touches down. It is important to note that driving distance is measured on only two holes per round, which are strategically selected to be opposite in direction and as parallel as possible to reduce any wind effects (Fairholm, 2024). However, the specific holes and their orientations remain undisclosed. Consequently, it becomes challenging to incorporate wind direction in a meaningful manner, which is why it was excluded from our analysis. If the wind aligns parallel to the measured holes, its effects will largely cancel out, resulting in an estimated wind effect that is likely smaller than the actual one.
A higher average dew point may reduce roll-out, as wetter fairway conditions slow the ball after landing due to an increase in resistance. Since driving distance includes both carry and roll, this could contribute to shorter overall drives. Precipitation is expected to have a similar effect, increasing surface moisture and further limiting roll. Dew on the club can also lead to reduced friction when hitting the ball, leading to less spin and therefore a reduced magnus effect, leading to less carry (On the Toe, 2024).
When comparing the total strokes models to the driving distance models, we would generally expect the signs to be opposite, as longer drives typically contribute to lower total strokes. However, there is some inconsistency: for example, the sum of precipitation, average dew point, and average humidity decrease driving distance but are also associated with a decrease in total strokes. These factors all relate to increased moisture conditions, which likely reduce fairway rollout but simultaneously soften the greens, allowing players to better control the ball and mitigate unexpected bounce, backspin, and excessive rollout that can occur on dry, firm greens and in windy conditions.
Weather conditions can influence golfers not only through the physical effects on ball flight, but also through physiological and psychological responses. For example, golfers may react differently to the weather based on the climates they are used to, and they may alter strategic decisions based on weather conditions (Gabriel, 2023). As a form of coping behavior, elite golfers may seek caddie support (Nicholls & Polman, 2008) while reacting to those extreme weather conditions, as caddies influence players’ performance and decision-making process (Pilgrim et al., 2016).
The role of the caddie has evolved alongside changes in rules and the adoption of new technologies. For instance, the LPGA Tour recently allowed the use of rangefinders (Nichols, 2021) to improve pace of play, as estimating distances from yardage books can be time consuming. Similarly, the PGA has also been testing rangefinders to increase pace of play (Hodowanic, 2025). At the same time, the Tour remains cautious about preserving traditional caddie and player skills—rangefinders are still prohibited from providing elevation adjustments or club selection advice during play. This is similar to the ban of green books that occurred in 2022, which players felt removed the skill of reading the greens (Colgan, 2021).
Our findings suggest that incorporating weather data into shot planning may further reshape the caddie’s responsibilities, given its significant effect on both performance and shot distance. This could include pre-round adjustments to yardage books based on forecasted conditions, as well as recalibrating club selection to reflect expected ball flight changes.
As we continue to investigate the relationship among weather conditions, distance, and performance, future studies may provide valuable insight in ways to mitigate the variance these effects have on players’ expectations for distances. For example, it may be possible to offer recommendations for various forms of golf ball and clubhead designs that mitigate the variance of distance for certain forms of weather conditions. Perhaps more stable differences like elevation and temperature would be a good starting point. This approach would allow a golfer in theory to choose a golf ball and clubhead designs for certain elevation and temperature ranges to minimize distance variances from normal conditions in which they play and practice.
The advantages of our approach to understanding how weather conditions might affect professional golf performance are apparent. Compared to Jowett and Phillips (2023), while the Masters is one of the four most prestigious professional golf events in the world, it is just one of many events in which the best golfers in the world compete for immense cash prizes. By utilizing a far more robust set of data, we can investigate the aim of this study across many other locations, seasons, and climates. Furthermore, the dependent variables of total strokes, and driving distance are more applicable metrics for evaluating the effects of weather conditions on golfer performance. When players understand the impact of weather conditions and can control the spin rate and distance more effectively after practices, they gain an advantage on the course. This allows them to minimize the likelihood of encountering unfavorable circumstances. For instance, a difference of just one foot in distance can determine whether a player lies on the fairway, in the semi-rough, rough, or even in a bunker. Playing from a bunker, as opposed to any other area including the rough, increases the average strokes taken by PGA Tour players (Plummer, 2024). Conversely, a well-placed shot can hold the green, significantly improving the likelihood of making a putt.
Another advantage of this paper is the greater precision of its weather data compared to Jowett and Phillips (2023). While that study recorded weather at the level of the mean across the entire time of play for a given round of the Masters, our approach utilizes mean weather measurements across every individual player’s round for a more granular and precise proxy. There is enormous potential for weather conditions to change throughout the course of one day of a golf event, especially in climates with highly variable weather patterns. When a round of an event can cover over 12 hours, it is important to tailor the measurement of weather conditions to that period of time that every golfer is playing.
These atmospheric data can also promote growth in off-course participation by enabling the simulation of realistic playing conditions and providing accurate distance predictions when combined with launch monitor technology. Launch monitors are increasingly popular among golfers of all skill levels who value advanced technological feedback during practice sessions. These findings could further inform instructional strategies aimed specifically at improving driving performance. As more statistical evidence becomes available, future research should extend into additional areas such as pitching, chipping, and putting, particularly regarding distance control and spin rate outcomes.
Conclusion
This study provides robust evidence that atmospheric conditions, particularly air density and its components, meaningfully affect professional golfer performance on the PGA Tour. Across models of both total strokes and driving distance, we find consistent and statistically significant effects of temperature, elevation, humidity, wind, dew point, and precipitation. Notably, lower air density is associated with both longer drives and fewer total strokes, aligning with findings from physics-based studies in other sports contexts.
While these results are statistically robust, some estimated magnitudes, especially for temperature, are larger than might be expected and should be interpreted with caution. These effects may, in part, reflect unobserved round-level factors not fully accounted for by our player fixed effects or available weather covariates. We therefore encourage future research to replicate and extend these findings using higher-frequency weather data or shot-level observations to better isolate causal effects.
These results suggest that weather conditions introduce systematic advantages and disadvantages within and across tournament rounds, challenging the notion that performance variation in golf is driven solely by skill or randomness. In practical terms, our findings support the development of player preparation strategies that incorporate environmental factors. Elite professional and amateur golfers may benefit from incorporating these insights into their club selection, shot planning, and course management approaches.
Beyond immediate performance implications, these results highlight new frontiers for technology, equipment design, and instruction in golf, particularly in developing tools that help players manage the variability introduced by weather. Future research might extend this approach to other performance domains in golf, such as putting or short game scenarios, where atmospheric conditions may also influence spin rates and shot outcomes.
Ultimately, while luck and randomness remain inherent aspects of golf, our analysis demonstrates that measurable environmental conditions play a substantial role in shaping player performance. Rather than viewing weather as an uncontrollable source of variance, it should be understood as a systematic and quantifiable component of the game, providing essential context for evaluating performance and success on the course.